
|
|
1 год назад | |
|---|---|---|
| .. | ||
| Makefile.am | 5 лет назад | |
| README.md | 1 год назад | |
| graphite.c | 1 год назад | |
| graphite.h | 2 лет назад | |
README.md
Export metrics to Graphite providers
You can use the Graphite connector for the exporting engine to archive your agent's metrics to Graphite providers for long-term storage, further analysis, or correlation with data from other sources.
Prerequisites
You have already installed Netdata and Graphite.
Configuration
Begin by using edit-config to open the exporting.conf file.
cd /etc/netdata   # Replace this path with your Netdata config directory
sudo ./edit-config exporting.conf
Enable the exporting engine by setting enabled to yes in the [exporting:global] section.
[exporting:global]
    enabled = yes
Next, configure the connector. Find the [graphite:my_graphite_instance] example section and uncomment the line.
Set the destination setting to localhost:2003. By default, the Docker image for Graphite listens on port 2003 for
incoming metrics. If you installed Graphite a different way, you may need to change the port accordingly.
[graphite:netdata]
    enabled = yes
    destination = localhost:2003
    ...
Add :http or :https modifiers to the connector type if you need to use other than a plaintext protocol. For
example: graphite:http:my_graphite_instance,
graphite:https:my_graphite_instance. You can set basic HTTP authentication credentials using
    username = my_username
    password = my_password
The final result for a remote, secured host should be the following:
[graphite:https:netdata]
    enabled = yes
    username = my_username
    password = my_password
    destination = remote_host_url:2003
    # data source = average
    # prefix = netdata
    # hostname = my_hostname
    # update every = 10
    # buffer on failures = 10
    # timeout ms = 20000
    # send names instead of ids = yes
    # send charts matching = *
    # send hosts matching = localhost *
We'll not worry about the rest of the settings
for now. Restart the Agent using sudo systemctl restart netdata, or the
appropriate method for your
system, to spin up the exporting engine.
See and organize Netdata metrics in Graphite
Head back to the Graphite interface again, then click on the Dashboard link to get started with Netdata's exported
metrics. You can also navigate directly to http://NODE/dashboard.
Let's switch the interface to help you understand which metrics Netdata is exporting to Graphite. Click on Dashboard and Configure UI, then choose the Tree option. Refresh your browser to change the UI.
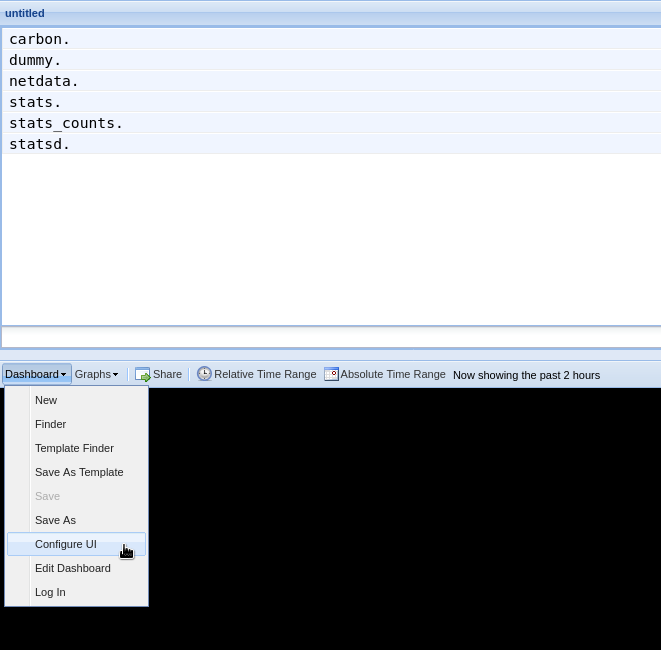
You should now see a tree of available contexts, including one that matches the hostname of the Agent exporting metrics.
In this example, the Agent's hostname is arcturus.
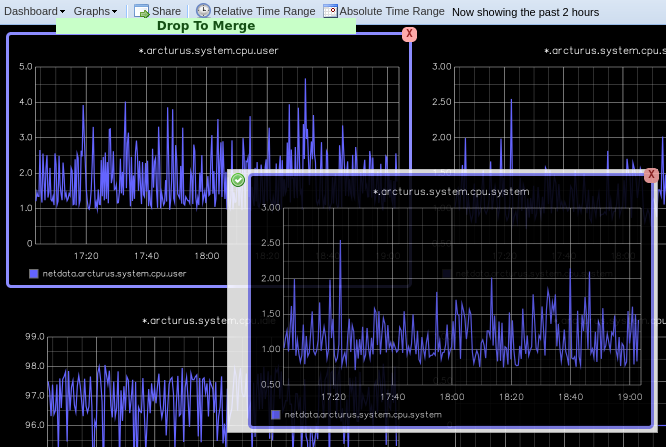
Let's add some system CPU charts so you can monitor the long-term health of your system. Click through the tree to find hostname → system → cpu metrics, then click on the user context. A chart with metrics from that context appears in the dashboard. Add a few other system CPU charts to flesh things out.
Next, let's combine one or two of these charts. Click and drag one chart onto the other, and wait until the green Drop to merge dialog appears. Release to merge the charts.
Finally, save your dashboard. Click Dashboard, then Save As, then choose a name. Your dashboard is now saved.
Of course, this is just the beginning of the customization you can do with Graphite. You can change the time range, share your dashboard with others, or use the composer to customize the size and appearance of specific charts. Learn more about adding, modifying, and combining graphs in the Graphite docs.
Monitor the exporting engine
As soon as the exporting engine begins, Netdata begins reporting metrics about the system's health and performance.
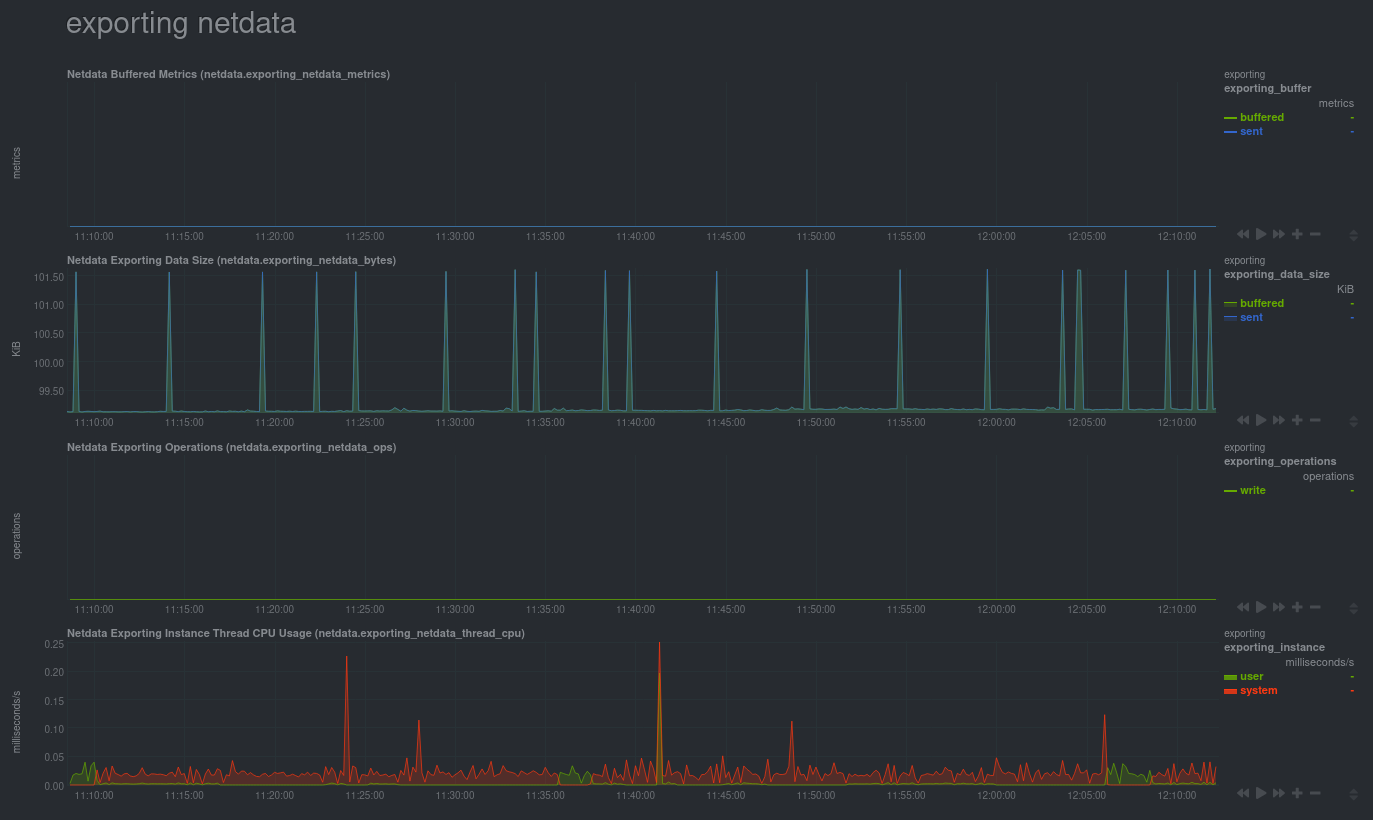
You can use these charts to verify that Netdata is properly exporting metrics to Graphite. You can even add these exporting charts to your Graphite dashboard!
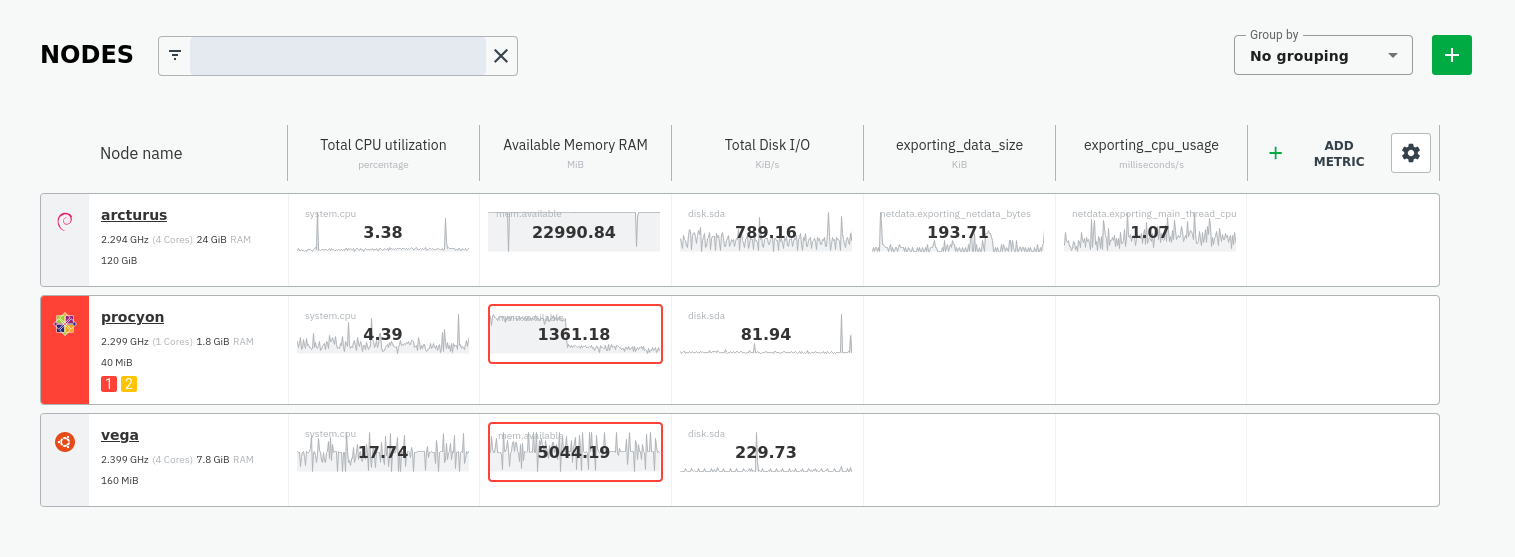
Add exporting charts to Netdata Cloud
You can also show these exporting engine metrics on Netdata Cloud. If you don't have an account already, go sign in and get started for free.
Add more metrics to a War Room's Nodes tab by clicking on the Add metric button, then typing exporting into the
context field. Choose the exporting contexts you want to add, then click Add. You'll see these charts alongside any
others you've customized in Netdata Cloud.
What's next
What you do with your exported metrics is entirely up to you, but as you might have seen in the Graphite connector configuration block, there are many other ways to tweak and customize which metrics you export to Graphite and how often.
For full details about each configuration option and what it does, see the exporting reference guide.