| 12345678910111213141516171819202122232425262728293031323334353637383940414243444546474849505152535455565758596061626364656667686970717273747576 |
- ---
- title: "View active alerts"
- description: >-
- "Track the health of your infrastructure in one place by taking advantage of the powerful health monitoring
- watchdog running on every node."
- type: "how-to"
- custom_edit_url: "https://github.com/netdata/netdata/blob/master/docs/cloud/alerts-notifications/view-active-alerts.mdx"
- sidebar_label: "View active alerts"
- learn_status: "Published"
- learn_topic_type: "Tasks"
- learn_rel_path: "Operations/Alerts"
- ---
- Netdata Cloud receives information about active alerts on individual nodes in your infrastructure and updates the
- interface based on those status changes.
- Netdata Cloud doesn't produce alerts itself but rather receives and aggregates alerts from each node in your
- infrastructure based on their configuration. Every node comes with hundreds of pre-configured alerts that have been
- tested by Netdata's community of DevOps engineers and SREs, but you may want to customize existing alerts or create new
- ones entirely.
- Read our doc on [health alerts](https://github.com/netdata/netdata/blob/master/docs/monitor/configure-alarms.md) to
- learn how to tweak existing alerts or create new
- health entities based on the specific needs of your infrastructure. By taking charge of alert configuration, you'll
- ensure Netdata Cloud always delivers the most relevant alerts about the well-being of your nodes.
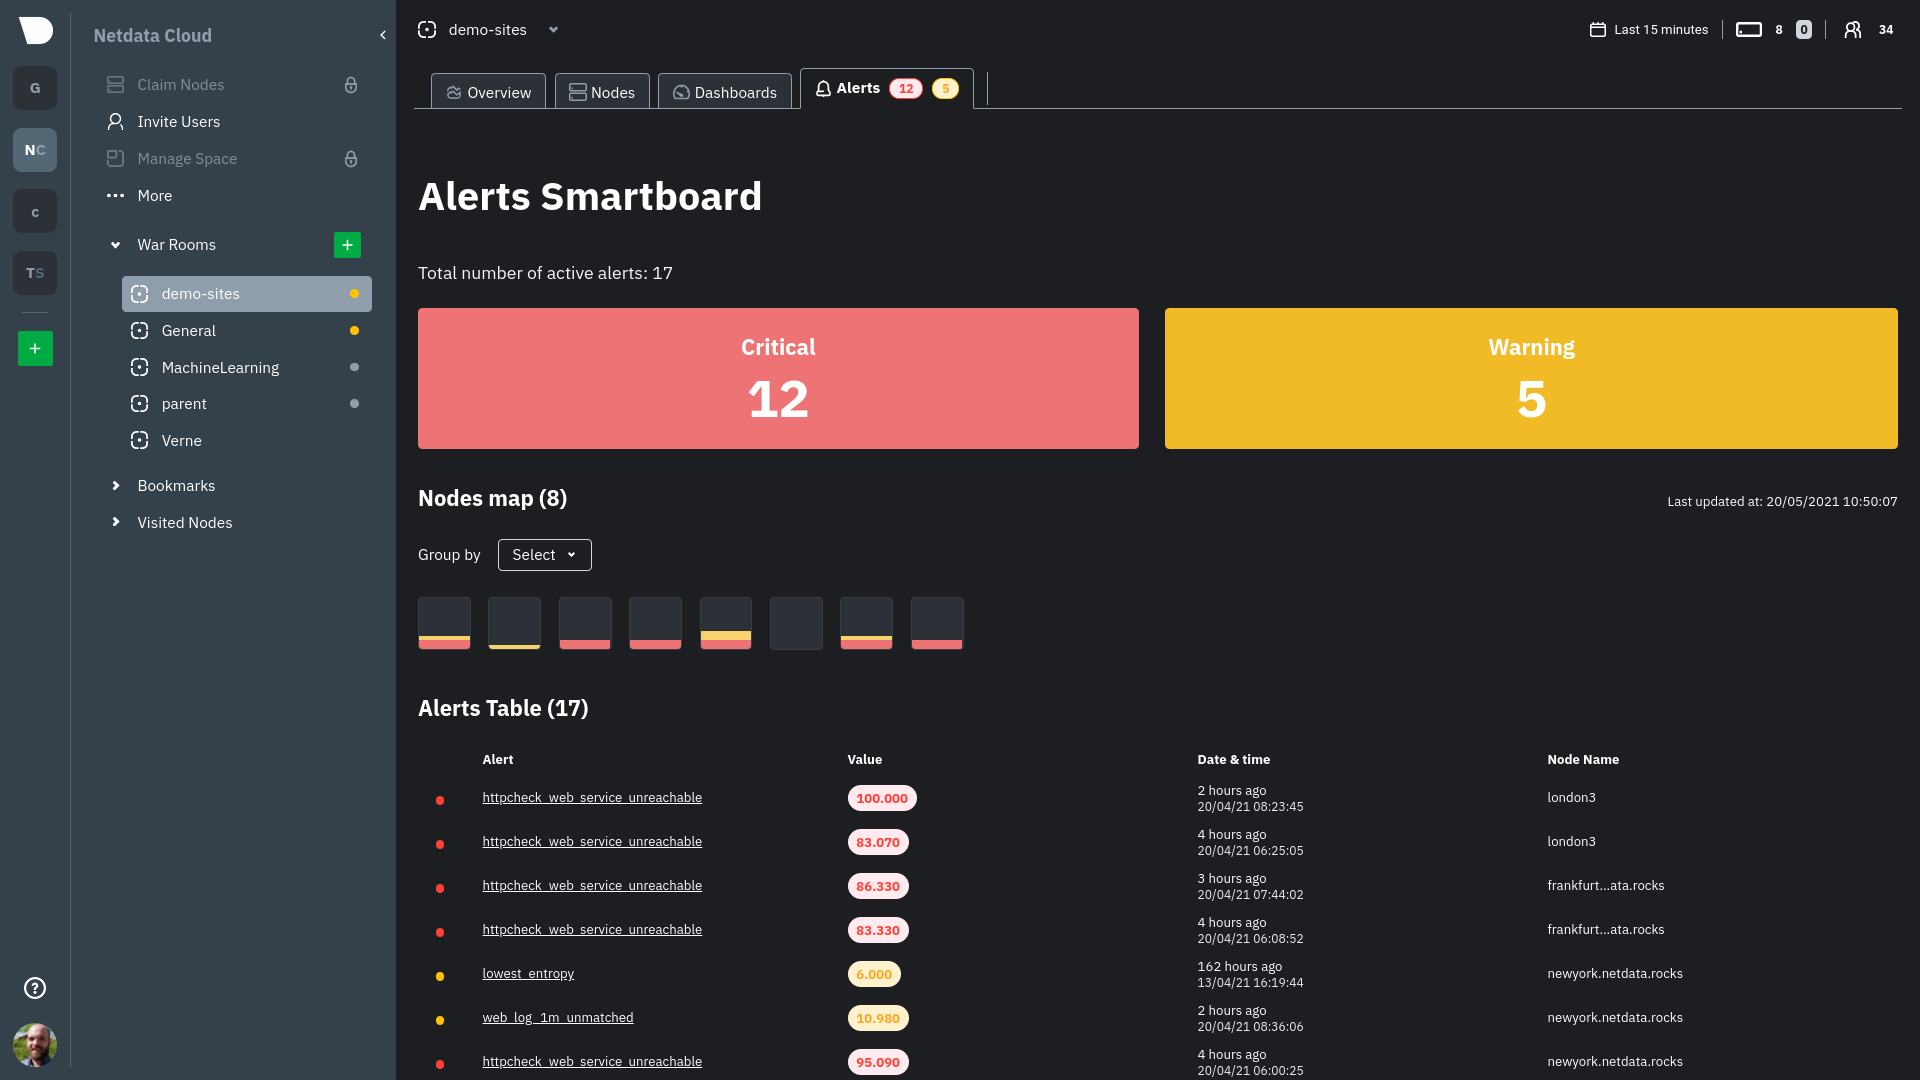
- ## View all active alerts
- The [Alerts Smartboard](https://github.com/netdata/netdata/blob/master/docs/cloud/alerts-notifications/smartboard.mdx)
- provides a high-level interface for viewing the number of critical or warning alerts and where they are in your
- infrastructure.
- 
- Click on the **Alerts** tab in any War Room to open the Smartboard. Alternatively, click on any of the alert badges in
- the [Nodes view](https://github.com/netdata/netdata/blob/master/docs/cloud/visualize/nodes.md) to jump to the Alerts
- Smartboard.
- From here, filter active alerts using the **critical** or **warning** boxes, or hover over a box in
- the [nodes map](https://github.com/netdata/netdata/blob/master/docs/cloud/alerts-notifications/smartboard.mdx#nodes-map)
- to see a
- popup node-specific alert information.
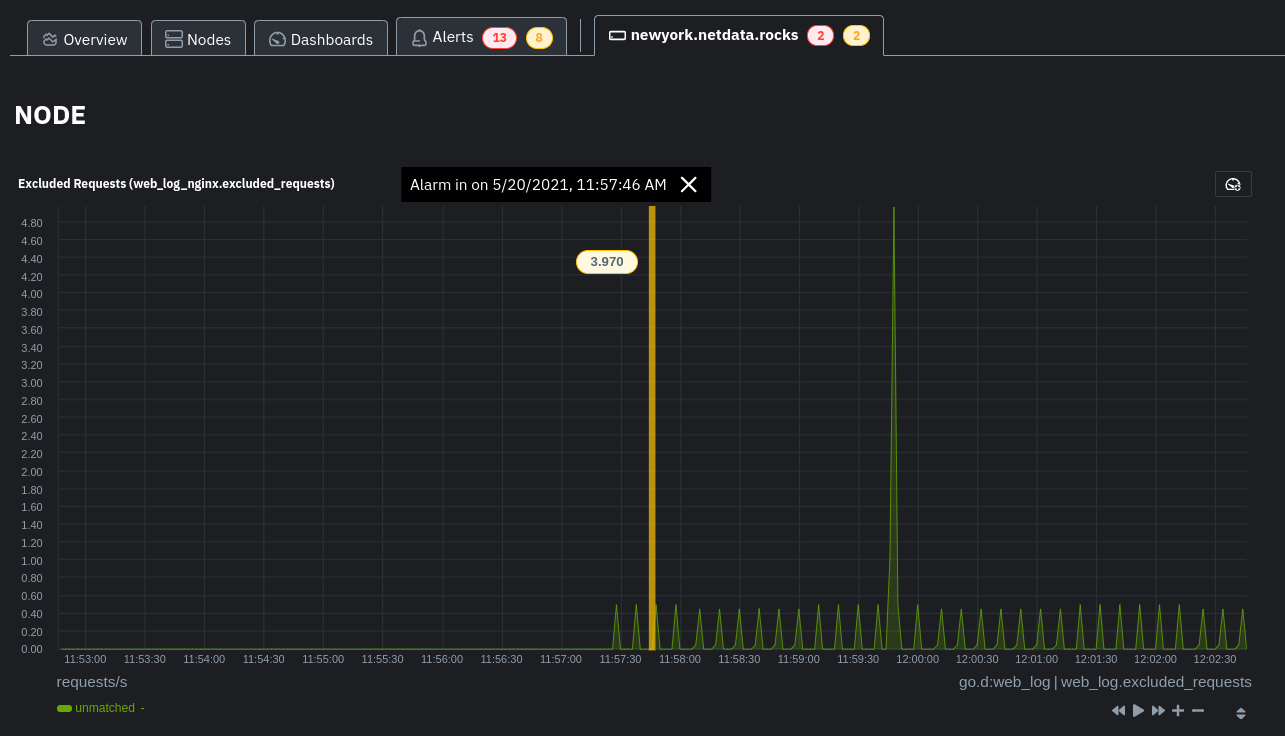
- ## View alerts in context with charts
- If you click on any of the alerts, either in a nodes map popup or the alerts table, Netdata Cloud navigates you to the
- single-node dashboard and scrolls to the relevant chart. Netdata Cloud also draws a highlight and the value at the
- moment your node triggered this alert.
- 
- You can
- then [select this area](https://github.com/netdata/netdata/blob/master/docs/dashboard/interact-charts.mdx#select)
- with `Alt/⌘ + mouse selection` to highlight the alerted timeframe while you explore other charts for root cause
- analysis.
- Or, select the area and
- run [Metric Correlations](https://github.com/netdata/netdata/blob/master/docs/cloud/insights/metric-correlations.md) to
- filter the single-node
- dashboard to only those charts most likely to be connected to the alert.
- ## What's next?
- Learn more about the features of the Smartboard in
- its [reference](https://github.com/netdata/netdata/blob/master/docs/cloud/alerts-notifications/smartboard.mdx)
- doc. To stay notified of active alerts,
- enable [centralized alert notifications](https://github.com/netdata/netdata/blob/master/docs/cloud/alerts-notifications/notifications.mdx)
- from Netdata Cloud.
- If you're through with setting up alerts, it might be time
- to [invite your team](https://github.com/netdata/netdata/blob/master/docs/cloud/manage/invite-your-team.md).
- Check out our recommendations on organizing and
- using [Spaces](https://github.com/netdata/netdata/blob/master/docs/cloud/spaces.md) and
- [War Rooms](https://github.com/netdata/netdata/blob/master/docs/cloud/war-rooms.md) to streamline your processes once
- you find an alert in Netdata Cloud.
|
