| 123456789101112131415161718192021222324252627282930313233343536373839404142434445464748495051525354555657585960616263646566676869707172737475767778798081828384858687888990919293949596979899100101102103104105106107108109110111112113114115116117118119120121 |
- ---
- title: "Visualization date and time controls"
- description: "Netdata's dashboard features powerful date visualization controls that include a time control (play, pause, force play), a timezone selector and a rich date and timeframe selector, with useful defaults and rich customization, to help you narrow your focus when troubleshooting issues or anomalies."
- type: how-to
- custom_edit_url: https://github.com/netdata/netdata/edit/master/docs/dashboard/visualization-date-and-time-controls.mdx
- ---
- # Visualization date and time controls
- ## Date and time selector
- ### Pick timeframes to visualize
- While [panning through time and zooming in/out](/docs/dashboard/interact-charts.mdx) from charts it is helpful when
- you're looking a recent history, or want to do granular troubleshooting, what if you want to see metrics from 6 hours
- ago? Or 6 days?
- Netdata's dashboard features a **timeframe selector** to help you visualize specific timeframes in a few helpful ways.
- By default, it shows a certain number of minutes of historical metrics based on the your browser's viewport to ensure
- it's always showing per-second granularity.
- #### Open the timeframe selector
- To visualize a new timeframe, you need to open the picker, which appears just above the menu, near the top-right cover
- of the dashboard.
- 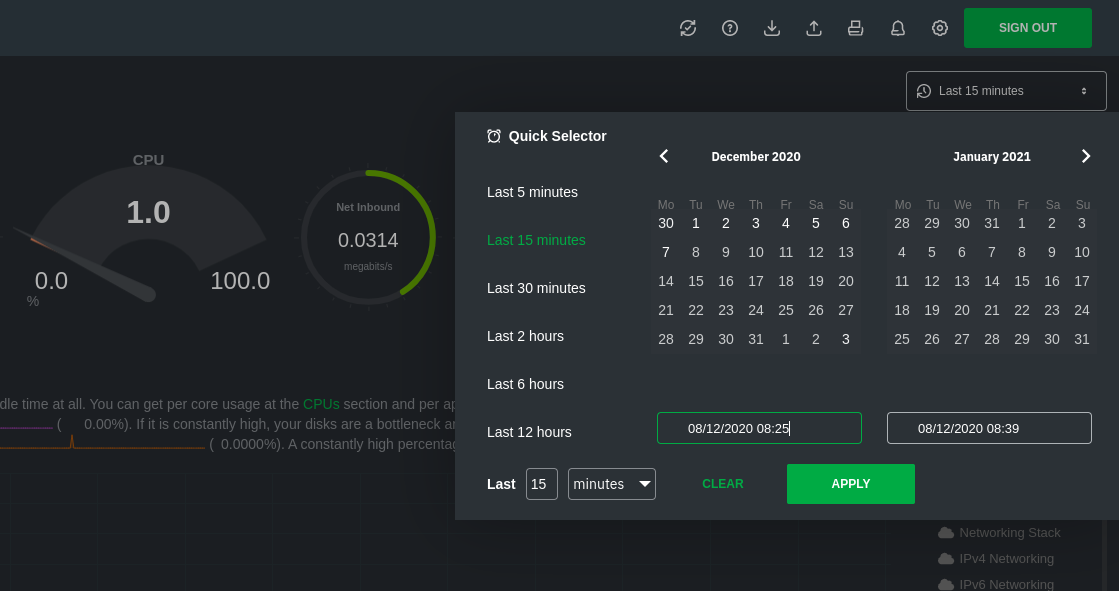
- The **Clear** button resets the dashboard back to its default state based on your browser viewport, and **Apply** closes
- the picker and shifts all charts to the selected timeframe.
- #### Use the Quick Selector
- Click any of the following options in the **Quick Selector** to choose a commonly-used timeframe.
- - Last 5 minutes
- - Last 15 minutes
- - Last 2 hours
- - Last 6 hours
- - Last 12 hours
- Click **Apply** to see metrics from your selected timeframe.
- #### Choose a specific interval
- Beneath the Quick Selector is an input field and dropdown you use in combination to select a specific timeframe of
- minutes, hours, days, or months. Enter a number and choose the appropriate unit of time, then click **Apply**.
- #### Choose multiple days
- Use the calendar to select multiple days. Click on a date to begin the timeframe selection, then an ending date. The
- timeframe begins at noon on the beginning and end dates. Click **Apply** to see your selected multi-day timeframe.
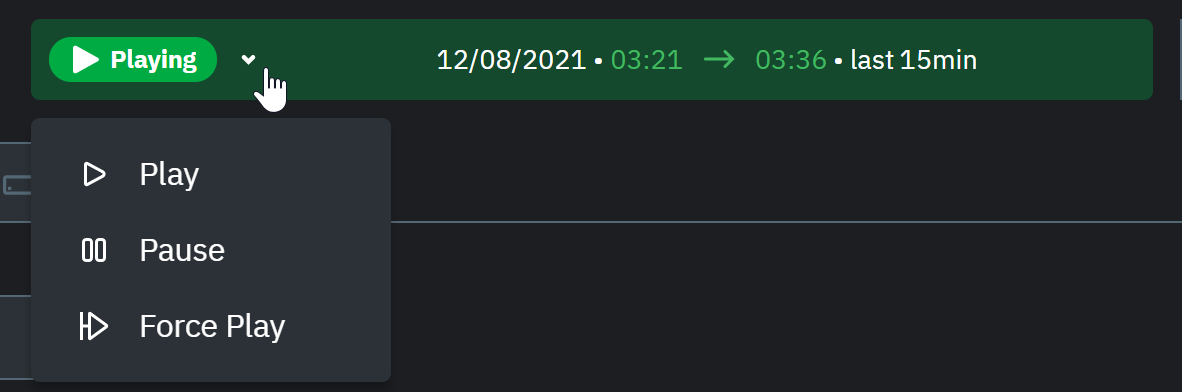
- ## Time controls
- The time control provides you the following options: **Play**, **Pause** and **Force Play**.
- * **Play** - the content of the page will be automatically refreshed while this is in the foreground
- * **Pause** - the content of the page isn't refreshed due to a manual request to pause it or, for example, when your investigating data on a
- chart (cursor is on top of a chart)
- * **Force Play** - the content of the page will be automatically refreshed even if this is in the background
- With this, we aim to bring more clarity and allow you to distinguish if the content you are looking at is live or historical and also allow you
- to always refresh the content of the page when the tabs are in the background.
- Main use cases for **Force Play**:
- * You use a terminal or deployment tools to do changes in your infra and want to see immediately, Netdata is in the background, displaying the impact
- of these changes
- * You want to have Netdata on the background, example displayed on a TV, to constantly see metrics through dashboards or to watch the alert
- status
- 
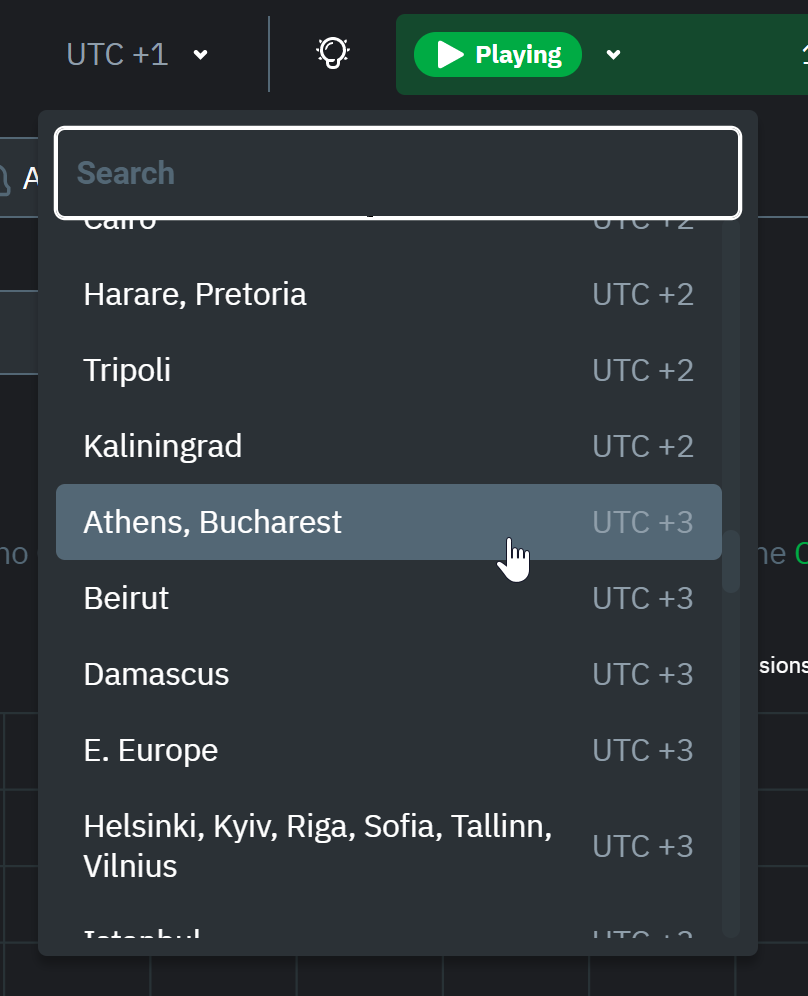
- ## Timezone selector
- With the timezone selector, you have the ability to change the timezone on Netdata Cloud. More often than not teams are
- distributed in different timezones and they need to collaborate.
- Our goal is to make it easier for you and your teams to troubleshoot based on your timezone preference and communicate easily
- with varying timezones and timeframes without the need to be concerned about their specificity.
- 
- When you change the timezone all the date and time fields will be updated to be displayed according to the specified timezone, this goes from
- charts to alerts information and across the Netdata Cloud.
- ## Caveats and considerations
- **Longer timeframes will decrease metrics granularity**. At the default timeframe, based on your browser viewport, each
- "tick" on charts represents one second. If you select a timeframe of 6 hours, each tick represents the _average_ value
- across a larger period of time.
- **You can only see metrics as far back in history as your metrics retention policy allows**. Netdata uses an internal
- time-series database (TSDB) to store as many metrics as it can within a specific amount of disk space. The default
- storage is 256 MiB, which should be enough for 1-3 days of historical metrics. If you navigate back to a timeframe
- beyond stored historical metrics, you'll see this message:
- 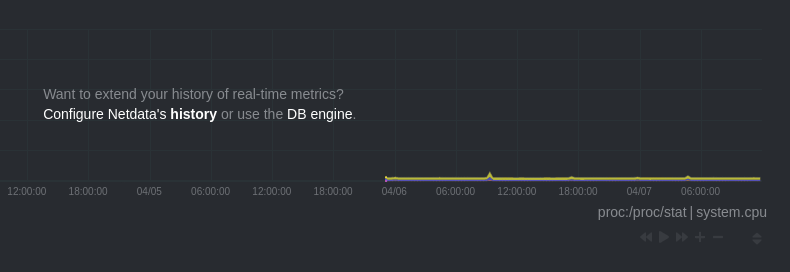
- At any time, [configure the internal TSDB's storage capacity](/docs/store/change-metrics-storage.md) to expand your
- depth of historical metrics.
- ## What's next?
- One useful next step after selecting a timeframe is [exporting the
- metrics](/docs/dashboard/import-export-print-snapshot.mdx) into a snapshot file, which can then be shared and imported
- into any other Netdata dashboard.
- There are also many ways to [customize](/docs/dashboard/customize.mdx) the standard dashboard experience, from changing
- the theme to editing the text that accompanies every section of charts.
- ## Further reading & related information
- - Dashboard
- - [How the dashboard works](/docs/dashboard/how-dashboard-works.mdx)
- - [Interact with charts](/docs/dashboard/interact-charts.mdx)
- - [Chart dimensions, contexts, and families](/docs/dashboard/dimensions-contexts-families.mdx)
- - [Import, export, and print a snapshot](/docs/dashboard/import-export-print-snapshot.mdx)
- - [Customize the standard dashboard](/docs/dashboard/customize.mdx)
|
