
README.md 9.3 KB
eBPF monitoring with Netdata
Netdata's extended Berkeley Packet Filter (eBPF) collector monitors kernel-level metrics for file descriptors, virtual filesystem IO, and process management on Linux systems. You can use our eBPF collector to analyze how and when a process accesses files, when it makes system calls, whether it leaks memory or creating zombie processes, and more.
Netdata's eBPF monitoring toolkit uses two custom eBPF programs. The default, called entry, monitors calls to a
variety of kernel functions, such as do_sys_open, __close_fd, vfs_read, vfs_write, _do_fork, and more. The
return program also monitors the return of each kernel functions to deliver more granular metrics about how your
system and its applications interact with the Linux kernel.
We expect eBPF monitoring to be particularly valuable in observing and debugging how the Linux kernel handles custom applications.
Enable the collector on Linux
The eBPF collector is installed and enabled by default on new nightly installations of the Agent. eBPF monitoring
only works on Linux systems and with specific Linux kernels, including all kernels newer than 4.11.0, and all kernels
on CentOS 7.6 or later.
If your Agent is v1.22 or older, you may to enable the collector yourself. See the configuration section for details.
Charts
The eBPF collector creates an eBPF menu in the Agent's dashboard along with three sub-menus: File, VFS, and Process. All the charts in this section update every second. The collector stores the actual value inside of its process, but charts only show the difference between the values collected in the previous and current seconds.
File
This group has two charts demonstrating how software interacts with the Linux kernel to open and close file descriptors.
File descriptor
This chart contains two dimensions that show the number of calls to the functions do_sys_open and __close_fd. Most
software do not commonly call these functions directly, but they are behind the system calls open(2), openat(2),
and close(2).
File error
This charts demonstrate the number of times some software tried and failed to open or close a file descriptor.
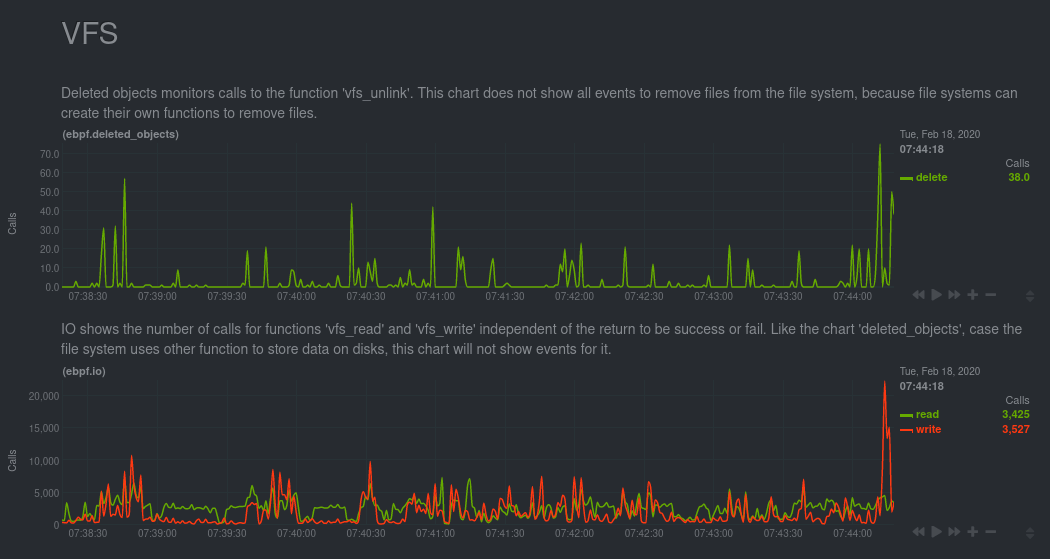
VFS
A virtual file system (VFS) is a layer on top of regular filesystems. The functions present inside this API are used for all filesystems, so it's possible the charts in this group won't show all the actions that occurred on your system.
Deleted objects
This chart monitors calls for vfs_unlink. This function is responsible for removing objects from the file system.
IO
This chart shows the number of calls to the functions vfs_read and vfs_write.
IO bytes
This chart also monitors vfs_read and vfs_write, but instead shows the total of bytes read and written with these
functions.
The Agent displays the number of bytes written as negative because they are moving down to disk.
IO errors
The Agent counts and shows the number of instances where a running program experiences a read or write error.
Process
For this group, the eBPF collector monitors process/thread creation and process end, and then displays any errors in the following charts.
Process thread
Internally, the Linux kernel treats both processes and threads as tasks. To create a thread, the kernel offers a few
system calls: fork(2), vfork(2) and clone(2). In turn, each of these system calls use the function _do_fork. To
generate this chart, the eBPF collector monitors _do_fork to populate the process dimension, and monitors
sys_clone to identify threads.
Exit
Ending a task requires two steps. The first is a call to the internal function do_exit, which notifies the operating
system that the task is finishing its work. The second step is to release the kernel information with the internal
function release_task. The difference between the two dimensions can help you discover zombie
processes.
Task error
The functions responsible for ending tasks do not return values, so this chart contains information about failures on process and thread creation.
Configuration
Enable or disable the entire eBPF collector by editing netdata.conf.
cd /etc/netdata/   # Replace with your Netdata configuration directory, if not /etc/netdata/
./edit-config netdata.conf
To enable the collector, scroll down to the [plugins] section ensure the relevant line references ebpf (not
ebpf_process), is uncommented, and is set to yes.
[plugins]
   ebpf = yes
You can also configure the eBPF collector's behavior by editing ebpf.conf.
cd /etc/netdata/   # Replace with your Netdata configuration directory, if not /etc/netdata/
./edit-config ebpf.conf
[global]
The [global] section defines settings for the whole eBPF collector.
ebpf load mode
The collector has two different eBPF programs. These programs monitor the same functions inside the kernel, but they monitor, process, and display different kinds of information.
By default, this plugin uses the entry mode. Changing this mode can create significant overhead on your operating
system, but also offer valuable information if you are developing or debugging software. The ebpf load mode option
accepts the following values:
entry: This is the default mode. In this mode, the eBPF collector only monitors calls for the functions described in the sections above, and does not show charts related to errors.return: In thereturnmode, the eBPF collector monitors the same kernel functions asentry, but also creates new charts for the return of these functions, such as errors. Monitoring function returns can help in debugging software, such as failing to close file descriptors or creating zombie processes.
Troubleshooting
If the eBPF collector does not work, you can troubleshoot it by running the ebpf.plugin command and investigating its output.
cd /usr/libexec/netdata/plugins.d/
sudo -u netdata bash
./ebpf.plugin
You can also use grep to search the Agent's error.log for messages related to eBPF monitoring.
grep -i ebpf /var/log/netdata/error.log
Confirm kernel compatibility
The eBPF collector only works on Linux systems and with specific Linux kernels. We support all kernels more recent than
4.11.0, and all kernels on CentOS 7.6 or later.
You can run our helper script to determine whether your system can support eBPF monitoring.
curl -sSL https://raw.githubusercontent.com/netdata/kernel-collector/master/tools/check-kernel-config.sh | sudo sh
If this script returns no output, your system is ready to compile and run the eBPF collector.
If you see a warning about a missing kerkel configuration (KPROBES KPROBES_ON_FTRACE HAVE_KPROBES BPF BPF_SYSCALL
BPF_JIT), you will need to recompile your kernel to support this configuration. The process of recompiling Linux
kernels varies based on your distribution and version. Read the documentation for your system's distribution to learn
more about the specific workflow for recompiling the kernel, ensuring that you set all the necessary
Mount debugfs and tracefs
The eBPF collector also requires both the tracefs and debugfs filesystems. Try mounting the tracefs and debugfs
filesystems using the commands below:
sudo mount -t debugfs nodev /sys/kernel/debug
sudo mount -t tracefs nodev /sys/kernel/tracing
If they are already mounted, you will see an error. You can also configure your system's /etc/fstab configuration to
mount these filesystems on startup.
Performance
Because eBPF monitoring is complex, we are evaluating the performance of this new collector in various real-world conditions, across various system loads, and when monitoring complex applications.
Our initial testing shows the performance of the eBPF collector is nearly identical to our apps.plugin collector, despite collecting and displaying much more sophisticated metrics. You can now use the eBPF to gather deeper insights without affecting the performance of your complex applications at any load.