
REFERENCE.md 60 KB
Configure alerts
Netdata's health watchdog is highly configurable, with support for dynamic thresholds, hysteresis, alarm templates, and more. You can tweak any of the existing alarms based on your infrastructure's topology or specific monitoring needs, or create new entities.
You can use health alarms in conjunction with any of Netdata's collectors (see the supported collector list) to monitor the health of your systems, containers, and applications in real time.
While you can see active alarms both on the local dashboard and Netdata Cloud, all health alarms are configured per node via individual Netdata Agents. If you want to deploy a new alarm across your infrastructure, you must configure each node with the same health configuration files.
Edit health configuration files
You can configure the Agent's health watchdog service by editing files in two locations:
The
[health]section innetdata.conf. By editing the daemon's behavior, you can disable health monitoring altogether, run health checks more or less often, and more. See daemon configuration for a table of all the available settings, their default values, and what they control.The individual
.conffiles inhealth.d/. These health entity files are organized by the type of metric they are performing calculations on or their associated collector. You should edit these files using theedit-configscript. For example:sudo ./edit-config health.d/cpu.conf.
Navigate to your Netdata config directory and
use edit-config to make changes to any of these files.
Edit individual alerts
For example, to edit the cpu.conf health configuration file, run:
sudo ./edit-config health.d/cpu.conf
Each health configuration file contains one or more health entities, which always begin with alarm: or template:.
For example, here is the first health entity in health.d/cpu.conf:
template: 10min_cpu_usage
      on: system.cpu
      os: linux
   hosts: *
  lookup: average -10m unaligned of user,system,softirq,irq,guest
   units: %
   every: 1m
    warn: $this > (($status >= $WARNING)  ? (75) : (85))
    crit: $this > (($status == $CRITICAL) ? (85) : (95))
   delay: down 15m multiplier 1.5 max 1h
    info: average cpu utilization for the last 10 minutes (excluding iowait, nice and steal)
      to: sysadmin
To tune this alarm to trigger warning and critical alarms at a lower CPU utilization, change the warn and crit lines
to the values of your choosing. For example:
    warn: $this > (($status >= $WARNING)  ? (60) : (75))
    crit: $this > (($status == $CRITICAL) ? (75) : (85))
Save the file and reload Netdata's health configuration to apply your changes.
Disable or silence alerts
Alerts and notifications can be disabled permanently via configuration changes, or temporarily, via the health management API. The available options are described below.
Disable all alerts
In the netdata.conf [health] section, set enabled to no, and restart the agent.
Disable some alerts
In the netdata.conf [health] section, set enabled alarms to a
simple pattern that
excludes one or more alerts. e.g. enabled alarms = !oom_kill * will load all alarms except oom_kill.
You can also edit the file where the alert is defined, comment out its definition, and reload Netdata's health configuration.
Silence an individual alert
You can stop receiving notification for an individual alert by changing the to: line to silent.
to: silent
This action requires that you reload Netdata's health configuration.
Temporarily disable alerts at runtime
When you need to frequently disable all or some alerts from triggering during certain times (for instance when running backups) you can use the health management API. The API allows you to issue commands to control the health engine's behavior without changing configuration, or restarting the agent.
Temporarily silence notifications at runtime
If you want health checks to keep running and alerts to keep getting triggered, but notifications to be suppressed temporarily, you can use the health management API. The API allows you to issue commands to control the health engine's behavior without changing configuration, or restarting the agent.
Write a new health entity
While tuning existing alarms may work in some cases, you may need to write entirely new health entities based on how your systems, containers, and applications work.
Read the health entity reference for a full listing of the format, syntax, and functionality of health entities.
To write a new health entity into a new file, navigate to your Netdata config directory,
then use touch to create a new file in the health.d/ directory. Use edit-config to start editing the file.
As an example, let's create a ram-usage.conf file.
sudo touch health.d/ram-usage.conf
sudo ./edit-config health.d/ram-usage.conf
For example, here is a health entity that triggers a warning alarm when a node's RAM usage rises above 80%, and a critical alarm above 90%:
 alarm: ram_usage
    on: system.ram
lookup: average -1m percentage of used
 units: %
 every: 1m
  warn: $this > 80
  crit: $this > 90
  info: The percentage of RAM being used by the system.
Let's look into each of the lines to see how they create a working health entity.
alarm: The name for your new entity. The name needs to follow these requirements:- Any alphabet letter or number.
- The symbols
.and_. - Cannot be
chart name,dimension name,family name, orchart variable names.
on: Which chart the entity listens to.lookup: Which metrics the alarm monitors, the duration of time to monitor, and how to process the metrics into a usable format.average: Calculate the average of all the metrics collected.-1m: Use metrics from 1 minute ago until now to calculate that average.percentage: Clarify that we're calculating a percentage of RAM usage.of used: Specify which dimension (used) on thesystem.ramchart you want to monitor with this entity.
units: Use percentages rather than absolute units.every: How often to perform thelookupcalculation to decide whether or not to trigger this alarm.warn/crit: The value at which Netdata should trigger a warning or critical alarm. This example uses simple syntax, but most pre-configured health entities use hysteresis to avoid superfluous notifications.info: A description of the alarm, which will appear in the dashboard and notifications.
In human-readable format:
This health entity, named ram_usage, watches the system.ram chart. It looks up the last 1 minute of metrics from the used dimension and calculates the average of all those metrics in a percentage format, using a % unit. The entity performs this lookup every minute.
If the average RAM usage percentage over the last 1 minute is more than 80%, the entity triggers a warning alarm. If the usage is more than 90%, the entity triggers a critical alarm.
When you finish writing this new health entity, reload Netdata's health configuration to see it live on the local dashboard or Netdata Cloud.
Reload health configuration
To make any changes to your health configuration live, you must reload Netdata's health monitoring system. To do that
without restarting all of Netdata, run netdatacli reload-health or killall -USR2 netdata.
Health entity reference
The following reference contains information about the syntax and options of health entities, which Netdata attaches to charts in order to trigger alarms.
Entity types
There are two entity types: alarms and templates. They have the same format and feature set—the only difference is their label.
Alarms are attached to specific charts and use the alarm label.
Templates define rules that apply to all charts of a specific context, and use the template label. Templates help
you apply one entity to all disks, all network interfaces, all MySQL databases, and so on.
Alarms have higher precedence and will override templates. If an alarm and template entity have the same name and attach to the same chart, Netdata will use the alarm.
Entity format
Netdata parses the following lines. Beneath the table is an in-depth explanation of each line's purpose and syntax.
- The
alarmortemplateline must be the first line of any entity. - The
online is always required. - The
everyline is required if not usinglookup. - Each entity must have at least one of the following lines:
lookup,calc,warn, orcrit. - A few lines use space-separated lists to define how the entity behaves. You can use
*as a wildcard or prefix with!for a negative match. Order is important, too! See our simple patterns docs for more examples. - Lines terminated by a
\are spliced together with the next line. The backslash is removed and the following line is joined with the current one. No space is inserted, so you may split a line anywhere, even in the middle of a word. This comes in handy if yourinfoline consists of several sentences.
| line | required | functionality |
|---|---|---|
alarm/template |
yes | Name of the alarm/template. |
on |
yes | The chart this alarm should attach to. |
class |
no | The general alarm classification. |
type |
no | What area of the system the alarm monitors. |
component |
no | Specific component of the type of the alarm. |
os |
no | Which operating systems to run this chart. |
hosts |
no | Which hostnames will run this alarm. |
plugin |
no | Restrict an alarm or template to only a certain plugin. |
module |
no | Restrict an alarm or template to only a certain module. |
charts |
no | Restrict an alarm or template to only certain charts. |
families |
no | Restrict a template to only certain families. |
lookup |
yes | The database lookup to find and process metrics for the chart specified through on. |
calc |
yes (see above) | A calculation to apply to the value found via lookup or another variable. |
every |
no | The frequency of the alarm. |
green/red |
no | Set the green and red thresholds of a chart. |
warn/crit |
yes (see above) | Expressions evaluating to true or false, and when true, will trigger the alarm. |
to |
no | A list of roles to send notifications to. |
exec |
no | The script to execute when the alarm changes status. |
delay |
no | Optional hysteresis settings to prevent floods of notifications. |
repeat |
no | The interval for sending notifications when an alarm is in WARNING or CRITICAL mode. |
options |
no | Add an option to not clear alarms. |
host labels |
no | Restrict an alarm or template to a list of matching labels present on a host. |
chart labels |
no | Restrict an alarm or template to a list of matching labels present on a host. |
info |
no | A brief description of the alarm. |
The alarm or template line must be the first line of any entity.
Alarm line alarm or template
This line starts an alarm or template based on the entity type you're interested in creating.
Alarm:
alarm: NAME
Template:
template: NAME
NAME can be any alpha character, with . (period) and _ (underscore) as the only allowed symbols, but the names
cannot be chart name, dimension name, family name, or chart variables names.
Alarm line on
This line defines the chart this alarm should attach to.
Alarms:
on: CHART
The value CHART should be the unique ID or name of the chart you're interested in, as shown on the dashboard. In the
image below, the unique ID is system.cpu.

Template:
on: CONTEXT
The value CONTEXT should be the context you want this template to attach to.
Need to find the context? Hover over the date on any given chart and look at the tooltip. In the image below, which
shows a disk I/O chart, the tooltip reads: proc:/proc/diskstats, disk.io.
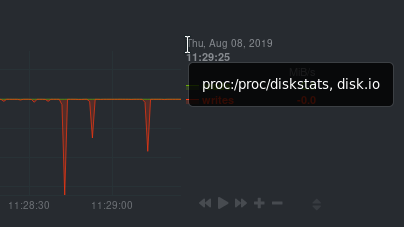
You're interested in what comes after the comma: disk.io. That's the name of the chart's context.
If you create a template using the disk.io context, it will apply an alarm to every disk available on your system.
Alarm line class
This indicates the type of error (or general problem area) that the alarm or template applies to. For example, Latency can be used for alarms that trigger on latency issues on network interfaces, web servers, or database systems. Example:
class: Latency
Netdata's stock alarms use the following `class` attributes by default:
| Class | | ----------------| | Errors | | Latency | | Utilization | | Workload |class will default to Unknown if the line is missing from the alarm configuration.
Alarm line type
Type can be used to indicate the broader area of the system that the alarm applies to. For example, under the general Database type, you can group together alarms that operate on various database systems, like MySQL, CockroachDB, CouchDB etc. Example:
type: Database
Netdata's stock alarms use the following `type` attributes by default, but feel free to adjust for your own requirements.
| Type | Description | |-----------------|------------------------------------------------------------------------------------------------| | Ad Filtering | Services related to Ad Filtering (like pi-hole) | | Certificates | Certificates monitoring related | | Cgroups | Alerts for cpu and memory usage of control groups | | Computing | Alerts for shared computing applications (e.g. boinc) | | Containers | Container related alerts (e.g. docker instances) | | Database | Database systems (e.g. MySQL, PostgreSQL, etc) | | Data Sharing | Used to group together alerts for data sharing applications | | DHCP | Alerts for dhcp related services | | DNS | Alerts for dns related services | | Kubernetes | Alerts for kubernetes nodes monitoring | | KV Storage | Key-Value pairs services alerts (e.g. memcached) | | Linux | Services specific to Linux (e.g. systemd) | | Messaging | Alerts for message passing services (e.g. vernemq) | | Netdata | Internal Netdata components monitoring | | Other | When an alert doesn't fit in other types. | | Power Supply | Alerts from power supply related services (e.g. apcupsd) | | Search engine | Alerts for search services (e.g. elasticsearch) | | Storage | Class for alerts dealing with storage services (storage devices typically live under `System`) | | System | General system alarms (e.g. cpu, network, etc.) | | Virtual Machine | Virtual Machine software | | Web Proxy | Web proxy software (e.g. squid) | | Web Server | Web server software (e.g. Apache, ngnix, etc.) | | Windows | Alerts for monitor of windows services |If an alarm configuration is missing the type line, its value will default to Unknown.
Alarm line component
Component can be used to narrow down what the previous type value specifies for each alarm or template. Continuing from the previous example, component might include MySQL, CockroachDB, MongoDB, all under the same Database type. Example:
component: MySQL
As with the class and type line, if component is missing from the configuration, its value will default to Unknown.
Alarm line os
The alarm or template will be used only if the operating system of the host matches this list specified in os. The
value is a space-separated list.
The following example enables the entity on Linux, FreeBSD, and macOS, but no other operating systems.
os: linux freebsd macos
Alarm line hosts
The alarm or template will be used only if the hostname of the host matches this space-separated list.
The following example will load on systems with the hostnames server and server2, and any system with hostnames that
begin with database. It will not load on the host redis3, but will load on any other systems with hostnames that
begin with redis.
hosts: server1 server2 database* !redis3 redis*
Alarm line plugin
The plugin line filters which plugin within the context this alarm should apply to. The value is a space-separated
list of simple patterns. For example,
you can create a filter for an alarm that applies specifically to python.d.plugin:
plugin: python.d.plugin
The plugin line is best used with other options like module. When used alone, the plugin line creates a very
inclusive filter that is unlikely to be of much use in production. See module for a
comprehensive example using both.
Alarm line module
The module line filters which module within the context this alarm should apply to. The value is a space-separated
list of simple patterns. For
example, you can create an alarm that applies only on the isc_dhcpd module started by python.d.plugin:
plugin: python.d.plugin
module: isc_dhcpd
Alarm line charts
The charts line filters which chart this alarm should apply to. It is only available on entities using the
template line.
The value is a space-separated list of simple patterns. For
example, a template that applies to disk.svctm (Average Service Time) context, but excludes the disk sdb from alarms:
template: disk_svctm_alarm
      on: disk.svctm
  charts: !*sdb* *
Alarm line families
The families line, used only alongside templates, filters which families within the context this alarm should apply
to. The value is a space-separated list.
The value is a space-separate list of simple patterns. See our simple patterns docs for some examples.
For example, you can create a template on the disk.io context, but filter it to only the sda and sdb families:
families: sda sdb
Please note that the use of the families filter is planned to be deprecated in upcoming Netdata releases.
Please use chart labels instead.
Alarm line lookup
This line makes a database lookup to find a value. This result of this lookup is available as $this.
The format is:
lookup: METHOD AFTER [at BEFORE] [every DURATION] [OPTIONS] [of DIMENSIONS] [foreach DIMENSIONS]
The full database query API is supported. In short:
METHODis one of the available grouping methods such asaverage,min,maxetc. This is required.AFTERis a relative number of seconds, but it also accepts a single letter for changing the units, like-1s= 1 second in the past,-1m= 1 minute in the past,-1h= 1 hour in the past,-1d= 1 day in the past. You need a negative number (i.e. how far in the past to look for the value). This is required.at BEFOREis by default 0 and is not required. Using this you can define the end of the lookup. So data will be evaluated betweenAFTERandBEFORE.every DURATIONsets the updated frequency of the lookup (supports single letter units as above too).OPTIONSis a space separated list ofpercentage,absolute,min2max,unaligned,match-ids,match-names. Check the badges documentation for more info.of DIMENSIONSis optional and has to be the last parameter. Dimensions have to be separated by,or|. The space characters found in dimensions will be kept as-is (a few dimensions have spaces in their names). This accepts Netdata simple patterns (withwordsseparated by,or|instead of spaces) and thematch-idsandmatch-namesoptions affect the searches for dimensions.foreach DIMENSIONSis optional and works only with templates, will always be the last parameter, and uses the same,/|rules as theofparameter. Each dimension you specify inforeachwill use the same rule to trigger an alarm. If you set bothofandforeach, Netdata will ignore theofparameter and replace it with one of the dimensions you gave toforeach. This option allows you to use dimension templates to create dynamic alarms.
The result of the lookup will be available as $this and $NAME in expressions.
The timestamps of the timeframe evaluated by the database lookup is available as variables
$after and $before (both are unix timestamps).
Alarm line calc
A calc is designed to apply some calculation to the values or variables available to the entity. The result of the
calculation will be made available at the $this variable, overwriting the value from your lookup, to use in warning
and critical expressions.
When paired with lookup, calc will perform the calculation just after lookup has retrieved a value from Netdata's
database.
You can use calc without lookup if you are using other available variables.
The calc line uses expressions for its syntax.
calc: EXPRESSION
Alarm line every
Sets the update frequency of this alarm. This is the same to the every DURATION given
in the lookup lines.
Format:
every: DURATION
DURATION accepts s for seconds, m is minutes, h for hours, d for days.
Alarm lines green and red
Set the green and red thresholds of a chart. Both are available as $green and $red in expressions. If multiple
alarms define different thresholds, the ones defined by the first alarm will be used. These will eventually visualized
on the dashboard, so only one set of them is allowed. If you need multiple sets of them in different alarms, use
absolute numbers instead of $red and $green.
Format:
green: NUMBER
red: NUMBER
Alarm lines warn and crit
Define the expression that triggers either a warning or critical alarm. These are optional, and should evaluate to either true or false (or zero/non-zero).
The format uses Netdata's expressions syntax.
warn: EXPRESSION
crit: EXPRESSION
Alarm line to
This will be the first parameter of the script to be executed when the alarm switches status. Its meaning is left up to
the exec script.
The default exec script, alarm-notify.sh, uses this field as a space separated list of roles, which are then
consulted to find the exact recipients per notification method.
Format:
to: ROLE1 ROLE2 ROLE3 ...
Alarm line exec
The script that will be executed when the alarm changes status.
Format:
exec: SCRIPT
The default SCRIPT is Netdata's alarm-notify.sh, which supports all the notifications methods Netdata supports,
including custom hooks.
Alarm line delay
This is used to provide optional hysteresis settings for the notifications, to defend against notification floods. These
settings do not affect the actual alarm - only the time the exec script is executed.
Format:
delay: [[[up U] [down D] multiplier M] max X]
up Udefines the delay to be applied to a notification for an alarm that raised its status (i.e. CLEAR to WARNING, CLEAR to CRITICAL, WARNING to CRITICAL). For example,up 10s, the notification for this event will be sent 10 seconds after the actual event. This is used in hope the alarm will get back to its previous state within the duration given. The defaultUis zero.down Ddefines the delay to be applied to a notification for an alarm that moves to lower state (i.e. CRITICAL to WARNING, CRITICAL to CLEAR, WARNING to CLEAR). For example,down 1mwill delay the notification by 1 minute. This is used to prevent notifications for flapping alarms. The defaultDis zero.multiplier MmultipliesUandDwhen an alarm changes state, while a notification is delayed. The default multiplier is1.0.max Xdefines the maximum absolute notification delay an alarm may get. The defaultXismax(U * M, D * M)(i.e. the max duration ofUorDmultiplied once withM).Example:
delay: up 10s down 15m multiplier 2 max 1hThe time is
00:00:00and the status of the alarm is CLEAR.time of event new status delay notification will be sent why 00:00:01 WARNING up 10s00:00:11 first state switch 00:00:05 CLEAR down 15m x200:30:05 the alarm changes state while a notification is delayed, so it was multiplied 00:00:06 WARNING up 10s x2 x200:00:26 multiplied twice 00:00:07 CLEAR down 15m x2 x2 x200:45:07 multiplied 3 times. So:
UandDare multiplied byMevery time the alarm changes state (any state, not just their matching one) and a delay is in place.- All are reset to their defaults when the alarm switches state without a delay in place.
Alarm line repeat
Defines the interval between repeating notifications for the alarms in CRITICAL or WARNING mode. This will override the
default interval settings inherited from health settings in netdata.conf. The default settings for repeating
notifications are default repeat warning = DURATION and default repeat critical = DURATION which can be found in
health stock configuration, when one of these interval is bigger than 0, Netdata will activate the repeat notification
for CRITICAL, CLEAR and WARNING messages.
Format:
repeat: [off] [warning DURATION] [critical DURATION]
off: Turns off the repeating feature for the current alarm. This is effective when the default repeat settings has been enabled in health configuration.warning DURATION: Defines the interval when the alarm is in WARNING state. Use0sto turn off the repeating notification for WARNING mode.critical DURATION: Defines the interval when the alarm is in CRITICAL state. Use0sto turn off the repeating notification for CRITICAL mode.
Alarm line options
The only possible value for the options line is
options: no-clear-notification
For some alarms we need compare two time-frames, to detect anomalies. For example, health.d/httpcheck.conf has an
alarm template called web_service_slow that compares the average http call response time over the last 3 minutes,
compared to the average over the last hour. It triggers a warning alarm when the average of the last 3 minutes is twice
the average of the last hour. In such cases, it is easy to trigger the alarm, but difficult to tell when the alarm is
cleared. As time passes, the newest window moves into the older, so the average response time of the last hour will keep
increasing. Eventually, the comparison will find the averages in the two time-frames close enough to clear the alarm.
However, the issue was not resolved, it's just a matter of the newer data "polluting" the old. For such alarms, it's a
good idea to tell Netdata to not clear the notification, by using the no-clear-notification option.
Alarm line host labels
Defines the list of labels present on a host. See our host labels guide for an explanation of host labels and how to implement them.
For example, let's suppose that netdata.conf is configured with the following labels:
[host labels]
    installed = 20191211
    room = server
And more labels in netdata.conf for workstations:
[host labels]
    installed = 201705
    room = workstation
By defining labels inside of netdata.conf, you can now apply labels to alarms. For example, you can add the following
line to any alarms you'd like to apply to hosts that have the label room = server.
host labels: room = server
The host labels is a space-separated list that accepts simple patterns. For example, you can create an alarm
that will be applied to all hosts installed in the last decade with the following line:
host labels: installed = 201*
See our simple patterns docs for more examples.
Alarm line chart labels
Similar to host labels, the chart labels key can be used to filter if an alarm will load or not for a specific chart, based on
whether these chart labels match or not.
The list of chart labels present on each chart can be obtained from http://localhost:19999/api/v1/charts?all
For example, each disk_space chart defines a chart label called mount_point with each instance of this chart having
a value there of which mount point it monitors.
If you have an e.g. external disk mounted on /mnt/disk1 and you don't wish any related disk space alerts running for
it (but you do for all other mount points), you can add the following to the alert's configuration:
chart labels: mount_point=!/mnt/disk1 *`
The chart labels is a space-separated list that accepts simple patterns. If you use multiple different chart labels,
then the result is an OR between them. i.e. the following:
chart labels: mount_point=/mnt/disk1 device=sda`
Will create the alert if the mount_point is /mnt/disk1 or the device is sda. Furthermore, if a chart label name
is specified that does not exist in the chart, the chart won't be matched.
See our simple patterns docs for more examples.
Alarm line info
The info field can contain a small piece of text describing the alarm or template. This will be rendered in
notifications and UI elements whenever the specific alarm is in focus. An example for the ram_available alarm is:
info: percentage of estimated amount of RAM available for userspace processes, without causing swapping
info fields can contain special variables in their text that will be replaced during run-time to provide more specific alert information. Current variables supported are:
| variable | description |
|---|---|
| ${family} | Will be replaced by the family instance for the alert (e.g. eth0) |
| ${label:LABEL_NAME} | The variable will be replaced with the value of the label |
For example, an info field like the following:
info: average inbound utilization for the network interface ${family} over the last minute
Will be rendered on the alert acting on interface eth0 as:
info: average inbound utilization for the network interface eth0 over the last minute
An alert acting on a chart that has a chart label named e.g. target, with a value of https://netdata.cloud/,
can be enriched as follows:
info: average ratio of HTTP responses with unexpected status over the last 5 minutes for the site ${label:target}
Will become:
info: average ratio of HTTP responses with unexpected status over the last 5 minutes for the site https://netdata.cloud/
Please note that variable names are case sensitive.
Expressions
Netdata has an internal infix expression parser under libnetdata/eval. This parses expressions and creates an internal
structure that allows fast execution of them.
These operators are supported +, -, *, /, <, ==, <=, <>, !=, >, >=, &&, ||, !, AND, OR, NOT.
Boolean operators result in either 1 (true) or 0 (false).
The conditional evaluation operator ? is supported too. Using this operator IF-THEN-ELSE conditional statements can be
specified. The format is: (condition) ? (true expression) : (false expression). So, Netdata will first evaluate the
condition and based on the result will either evaluate true expression or false expression.
Example: ($this > 0) ? ($avail * 2) : ($used / 2).
Nested such expressions are also supported (i.e. true expression and false expression can contain conditional
evaluations).
Expressions also support the abs() function.
Expressions can have variables. Variables start with $. Check below for more information.
There are two special values you can use:
nan, for example$this != nanwill check if the variablethisis available. A variable can benanif the database lookup failed. All calculations (i.e. addition, multiplication, etc) with ananresult in anan.inf, for example$this != infwill check ifthisis not infinite. A value or variable can be set to infinite if divided by zero. All calculations (i.e. addition, multiplication, etc) with ainfresult in ainf.
Special use of the conditional operator
A common (but not necessarily obvious) use of the conditional evaluation operator is to provide hysteresis around the critical or warning thresholds. This usage helps to avoid bogus messages resulting from small variations in the value when it is varying regularly but staying close to the threshold value, without needing to delay sending messages at all.
An example of such usage from the default CPU usage alarms bundled with Netdata is:
warn: $this > (($status >= $WARNING)  ? (75) : (85))
crit: $this > (($status == $CRITICAL) ? (85) : (95))
The above say:
If the alarm is currently a warning, then the threshold for being considered a warning is 75, otherwise it's 85.
If the alarm is currently critical, then the threshold for being considered critical is 85, otherwise it's 95.
Which in turn, results in the following behavior:
While the value is rising, it will trigger a warning when it exceeds 85, and a critical alert when it exceeds 95.
While the value is falling, it will return to a warning state when it goes below 85, and a normal state when it goes below 75.
If the value is constantly varying between 80 and 90, then it will trigger a warning the first time it goes above 85, but will remain a warning until it goes below 75 (or goes above 85).
If the value is constantly varying between 90 and 100, then it will trigger a critical alert the first time it goes above 95, but will remain a critical alert goes below 85 (at which point it will return to being a warning).
Variables
You can find all the variables that can be used for a given chart, using
http://NODE:19999/api/v1/alarm_variables?chart=CHART_NAME, replacing NODE with the IP address or hostname for your
Agent dashboard. For example, variables for the system.cpu chart of the
registry.
If you don't know how to find the CHART_NAME, you can read about it here.
Netdata supports 3 internal indexes for variables that will be used in health monitoring.
The variables below can be used in both chart alarms and context templates.
Although the `alarm_variables` link shows you variables for a particular chart, the same variables can also be used in templates for charts belonging to a given [context](https://github.com/netdata/netdata/blob/master/web/README.md#contexts). The reason is that all charts of a given context are essentially identical, with the only difference being the [family](https://github.com/netdata/netdata/blob/master/web/README.md#families) that identifies a particular hardware or software instance. Charts and templates do not apply to specific families anyway, unless if you explicitly limit an alarm with the [alarm line `families`](#alarm-line-families).chart local variables. All the dimensions of the chart are exposed as local variables. The value of
$thisfor the other configured alarms of the chart also appears, under the name of each configured alarm.Charts also define a few special variables:
$last_collected_tis the unix timestamp of the last data collection$collected_total_rawis the sum of all the dimensions (their last collected values)$update_everyis the update frequency of the chart$greenand$redthe threshold defined in alarms (these are per chart - the chartsinherits them from the the first alarm that defined them)Chart dimensions define their last calculated (i.e. interpolated) value, exactly as shown on the charts, but also a variable with their name and suffix
_rawthat resolves to the last collected value - as collected and another with suffix_last_collected_tthat resolves to unix timestamp the dimension was last collected (there may be dimensions that fail to be collected while others continue normally).
family variables. Families are used to group charts together. For example all
eth0charts, havefamily = eth0. This index includes all local variables, but if there are overlapping variables, only the first are exposed.host variables. All the dimensions of all charts, including all alarms, in fullname. Fullname is
CHART.VARIABLE, whereCHARTis either the chart id or the chart name (both are supported).special variables* are:
$this, which is resolved to the value of the current alarm.$status, which is resolved to the current status of the alarm (the current = the last status, i.e. before the current database lookup and the evaluation of thecalcline). This values can be compared with$REMOVED,$UNINITIALIZED,$UNDEFINED,$CLEAR,$WARNING,$CRITICAL. These values are incremental, ie.$status > $CLEARworks as expected.$now, which is resolved to current unix timestamp.
Alarm statuses
Alarms can have the following statuses:
REMOVED- the alarm has been deleted (this happens when a SIGUSR2 is sent to Netdata to reload health configuration)UNINITIALIZED- the alarm is not initialized yetUNDEFINED- the alarm failed to be calculated (i.e. the database lookup failed, a division by zero occurred, etc)CLEAR- the alarm is not armed / raised (i.e. is OK)WARNING- the warning expression resulted in true or non-zeroCRITICAL- the critical expression resulted in true or non-zero
The external script will be called for all status changes.
Example alarms
Check the health/health.d/ directory for all alarms shipped with Netdata.
Here are a few examples:
Example 1 - check server alive
A simple check if an apache server is alive:
template: apache_last_collected_secs
      on: apache.requests
    calc: $now - $last_collected_t
   every: 10s
    warn: $this > ( 5 * $update_every)
    crit: $this > (10 * $update_every)
The above checks that Netdata is able to collect data from apache. In detail:
template: apache_last_collected_secs
The above defines a template named apache_last_collected_secs.
The name is important since $apache_last_collected_secs resolves to the calc line.
So, try to give something descriptive.
on: apache.requests
The above applies the template to all charts that have context = apache.requests
(i.e. all your apache servers).
calc: $now - $last_collected_t
$nowis a standard variable that resolves to the current timestamp.$last_collected_tis the last data collection timestamp of the chart. So this calculation gives the number of seconds passed since the last data collection.every: 10s
The alarm will be evaluated every 10 seconds.
    warn: $this > ( 5 * $update_every)
    crit: $this > (10 * $update_every)
If these result in non-zero or true, they trigger the alarm.
$thisrefers to the value of this alarm (i.e. the result of thecalcline. We could also use$apache_last_collected_secs.
$update_every is the update frequency of the chart, in seconds.
So, the warning condition checks if we have not collected data from apache for 5 iterations and the critical condition checks for 10 iterations.
Example 2 - disk space
Check if any of the disks is critically low on disk space:
template: disk_full_percent
      on: disk.space
    calc: $used * 100 / ($avail + $used)
   every: 1m
    warn: $this > 80
    crit: $this > 95
  repeat: warning 120s critical 10s
$used and $avail are the used and avail chart dimensions as shown on the dashboard.
So, the calc line finds the percentage of used space. $this resolves to this percentage.
This is a repeating alarm and if the alarm becomes CRITICAL it repeats the notifications every 10 seconds. It also repeats notifications every 2 minutes if the alarm goes into WARNING mode.
Example 3 - disk fill rate
Predict if any disk will run out of space in the near future.
We do this in 2 steps:
Calculate the disk fill rate:
    template: disk_fill_rate
          on: disk.space
      lookup: max -1s at -30m unaligned of avail
        calc: ($this - $avail) / (30 * 60)
       every: 15s
In the calc line: $this is the result of the lookup line (i.e. the free space 30 minutes
ago) and $avail is the current disk free space. So the calc line will either have a positive
number of GB/second if the disk if filling up, or a negative number of GB/second if the disk is
freeing up space.
There is no warn or crit lines here. So, this template will just do the calculation and
nothing more.
Predict the hours after which the disk will run out of space:
    template: disk_full_after_hours
          on: disk.space
        calc: $avail / $disk_fill_rate / 3600
       every: 10s
        warn: $this > 0 and $this < 48
        crit: $this > 0 and $this < 24
The calc line estimates the time in hours, we will run out of disk space. Of course, only
positive values are interesting for this check, so the warning and critical conditions check
for positive values and that we have enough free space for 48 and 24 hours respectively.
Once this alarm triggers we will receive an email like this:

Example 4 - dropped packets
Check if any network interface is dropping packets:
template: 30min_packet_drops
      on: net.drops
  lookup: sum -30m unaligned absolute
   every: 10s
    crit: $this > 0
The lookup line will calculate the sum of the all dropped packets in the last 30 minutes.
The crit line will issue a critical alarm if even a single packet has been dropped.
Note that the drops chart does not exist if a network interface has never dropped a single packet. When Netdata detects a dropped packet, it will add the chart and it will automatically attach this alarm to it.
Example 5 - CPU usage
Check if user or system dimension is using more than 50% of cpu:
template: cpu_template
      on: system.cpu
      os: linux
  lookup: average -1m foreach system,user
   units: %
   every: 10s
    warn: $this > 50
    crit: $this > 80
The lookup line will calculate the average CPU usage from system and user over the last minute. Because we have
the foreach in the lookup line, Netdata will create two independent alarms called cpu_template_system
and dim_template_user that will have all the other parameters shared among them.
Example 6 - CPU usage
Check if all dimensions are using more than 50% of cpu:
template: cpu_template
      on: system.cpu
      os: linux
  lookup: average -1m foreach *
   units: %
   every: 10s
    warn: $this > 50
    crit: $this > 80
The lookup line will calculate the average of CPU usage from system and user over the last minute. In this case
Netdata will create alarms for all dimensions of the chart.
Example 7 - Z-Score based alarm
Derive a "Z Score" based alarm on user dimension of the system.cpu chart:
 alarm: cpu_user_mean
    on: system.cpu
lookup: mean -60s of user
 every: 10s

 alarm: cpu_user_stddev
    on: system.cpu
lookup: stddev -60s of user
 every: 10s

 alarm: cpu_user_zscore
    on: system.cpu
lookup: mean -10s of user
  calc: ($this - $cpu_user_mean) / $cpu_user_stddev
 every: 10s
  warn: $this < -2 or $this > 2
  crit: $this < -3 or $this > 3
Since z = (x - mean) / stddev we create two input alarms, one for mean and one for stddev and then use them both as inputs in our final cpu_user_zscore alarm.
Example 8 - Anomaly rate based CPU dimensions alarm
Warning if 5 minute rolling anomaly rate for any CPU dimension is above 5%, critical if it goes above 20%:
template: ml_5min_cpu_dims
      on: system.cpu
      os: linux
   hosts: *
  lookup: average -5m anomaly-bit foreach *
    calc: $this
   units: %
   every: 30s
    warn: $this > (($status >= $WARNING)  ? (5) : (20))
    crit: $this > (($status == $CRITICAL) ? (20) : (100))
    info: rolling 5min anomaly rate for each system.cpu dimension
The lookup line will calculate the average anomaly rate of each system.cpu dimension over the last 5 minues. In this case
Netdata will create alarms for all dimensions of the chart.
Example 9 - Anomaly rate based CPU chart alarm
Warning if 5 minute rolling anomaly rate averaged across all CPU dimensions is above 5%, critical if it goes above 20%:
template: ml_5min_cpu_chart
      on: system.cpu
      os: linux
   hosts: *
  lookup: average -5m anomaly-bit of *
    calc: $this
   units: %
   every: 30s
    warn: $this > (($status >= $WARNING)  ? (5) : (20))
    crit: $this > (($status == $CRITICAL) ? (20) : (100))
    info: rolling 5min anomaly rate for system.cpu chart
The lookup line will calculate the average anomaly rate across all system.cpu dimensions over the last 5 minues. In this case
Netdata will create one alarm for the chart.
Example 10 - Anomaly rate based node level alarm
Warning if 5 minute rolling anomaly rate averaged across all ML enabled dimensions is above 5%, critical if it goes above 20%:
template: ml_5min_node
      on: anomaly_detection.anomaly_rate
      os: linux
   hosts: *
  lookup: average -5m of anomaly_rate
    calc: $this
   units: %
   every: 30s
    warn: $this > (($status >= $WARNING)  ? (5) : (20))
    crit: $this > (($status == $CRITICAL) ? (20) : (100))
    info: rolling 5min anomaly rate for all ML enabled dims
The lookup line will use the anomaly_rate dimension of the anomaly_detection.anomaly_rate ML chart to calculate the average node level anomaly rate over the last 5 minues.
Use dimension templates to create dynamic alarms
In v1.18 of Netdata, we introduced dimension templates for alarms, which simplifies the process of writing alarm entities for charts with many dimensions.
Dimension templates can condense many individual entities into one—no more copy-pasting one entity and changing the
alarm/template and lookup lines for each dimension you'd like to monitor.
The fundamentals of foreach
Note: works only with templates.
Our dimension templates update creates a new foreach parameter to the
existing lookup line. This
is where the magic happens.
You use the foreach parameter to specify which dimensions you want to monitor with this single alarm. You can separate
them with a comma (,) or a pipe (|). You can also use
a Netdata simple pattern to create
many alarms with a regex-like syntax.
The foreach parameter has to be the last parameter in your lookup line, and if you have both of and foreach in
the same lookup line, Netdata will ignore the of parameter and use foreach instead.
Let's get into some examples so you can see how the new parameter works.
⚠️ The following entities are examples to showcase the functionality and syntax of dimension templates. They are not meant to be run as-is on production systems.
Condensing entities with foreach
Let's say you want to monitor the system, user, and nice dimensions in your system's overall CPU utilization.
Before dimension templates, you would need the following three entities:
 alarm: cpu_system
    on: system.cpu
lookup: average -10m of system
 every: 1m
  warn: $this > 50
  crit: $this > 80

 alarm: cpu_user
    on: system.cpu
lookup: average -10m of user
 every: 1m
  warn: $this > 50
  crit: $this > 80

 alarm: cpu_nice
    on: system.cpu
lookup: average -10m of nice
 every: 1m
  warn: $this > 50
  crit: $this > 80
With dimension templates, you can condense these into a single template. Take note of the alarm and lookup lines.
template: cpu_template
      on: system.cpu
  lookup: average -10m foreach system,user,nice
   every: 1m
    warn: $this > 50
    crit: $this > 80
The template line specifies the naming scheme Netdata will use. You can use whatever naming scheme you'd like, with .
and _ being the only allowed symbols.
The lookup line has changed from of to foreach, and we're now passing three dimensions.
In this example, Netdata will create three alarms with the names cpu_template_system, cpu_template_user, and
cpu_template_nice. Every minute, each alarm will use the same database query to calculate the average CPU usage for
the system, user, and nice dimensions over the last 10 minutes and send out alarms if necessary.
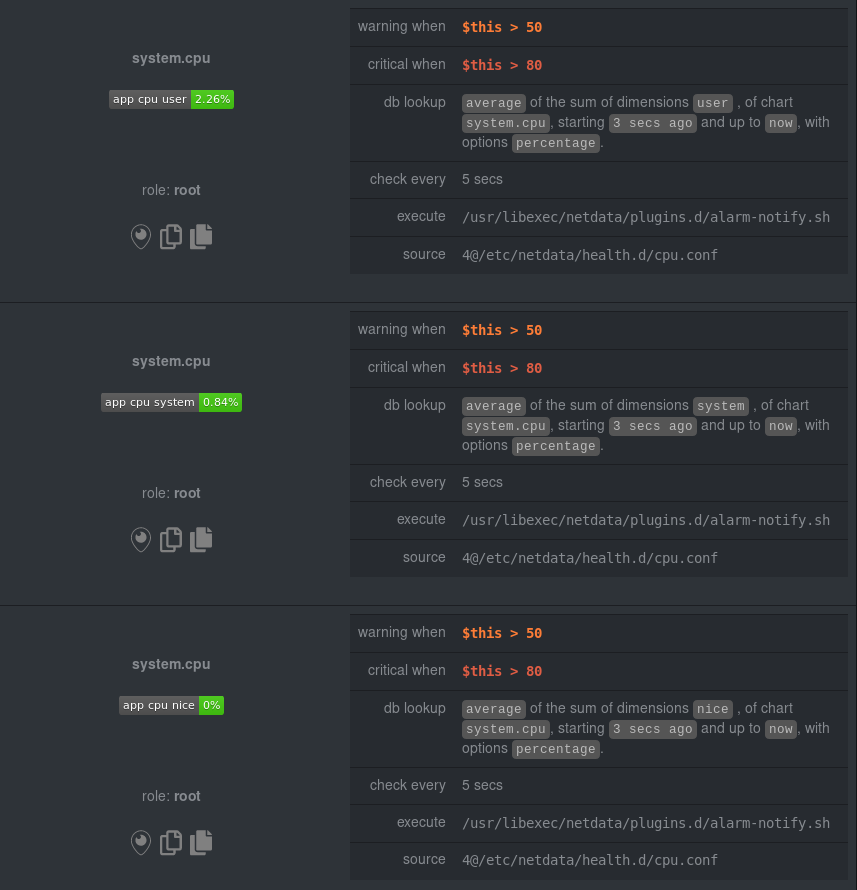
You can find these three alarms active by clicking on the Alarms button in the top navigation, and then clicking on the All tab and scrolling to the system - cpu collapsible section.
Let's look at some other examples of how foreach works so you can best apply it in your configurations.
Using a Netdata simple pattern in foreach
In the last example, we used foreach system,user,nice to create three distinct alarms using dimension templates. But
what if you want to quickly create alarms for all the dimensions of a given chart?
Use a simple pattern! One example of a simple pattern is a single wildcard
(*).
Instead of monitoring system CPU usage, let's monitor per-application CPU usage using the apps.cpu chart. Passing a
wildcard as the simple pattern tells Netdata to create a separate alarm for every process on your system:
 alarm: app_cpu
    on: apps.cpu
lookup: average -10m percentage foreach *
 every: 1m
  warn: $this > 50
  crit: $this > 80
This entity will now create alarms for every dimension in the apps.cpu chart. Given that most apps.cpu charts have
10 or more dimensions, using the wildcard ensures you catch every CPU-hogging process.
To learn more about how to use simple patterns with dimension templates, see our simple patterns documentation.
Using foreach with alarm templates
Dimension templates also work with alarm templates. Alarm templates help you create alarms for all the charts with a given context—for example, all the cores of your system's CPU.
By combining the two, you can create dozens of individual alarms with a single template entity. Here's how you would
create alarms for the system, user, and nice dimensions for every chart in the cpu.cpu context—or, in other
words, every CPU core.
template: cpu_template
      on: cpu.cpu
  lookup: average -10m percentage foreach system,user,nice
   every: 1m
    warn: $this > 50
    crit: $this > 80
On a system with a 6-core, 12-thread Ryzen 5 1600 CPU, this one entity creates alarms on the following charts and dimensions:
cpu.cpu0cpu_template_usercpu_template_systemcpu_template_nice
cpu.cpu1cpu_template_usercpu_template_systemcpu_template_nice
cpu.cpu2cpu_template_usercpu_template_systemcpu_template_nice
...
cpu.cpu11cpu_template_usercpu_template_systemcpu_template_nice
And how just a few of those dimension template-generated alarms look like in the Netdata dashboard.
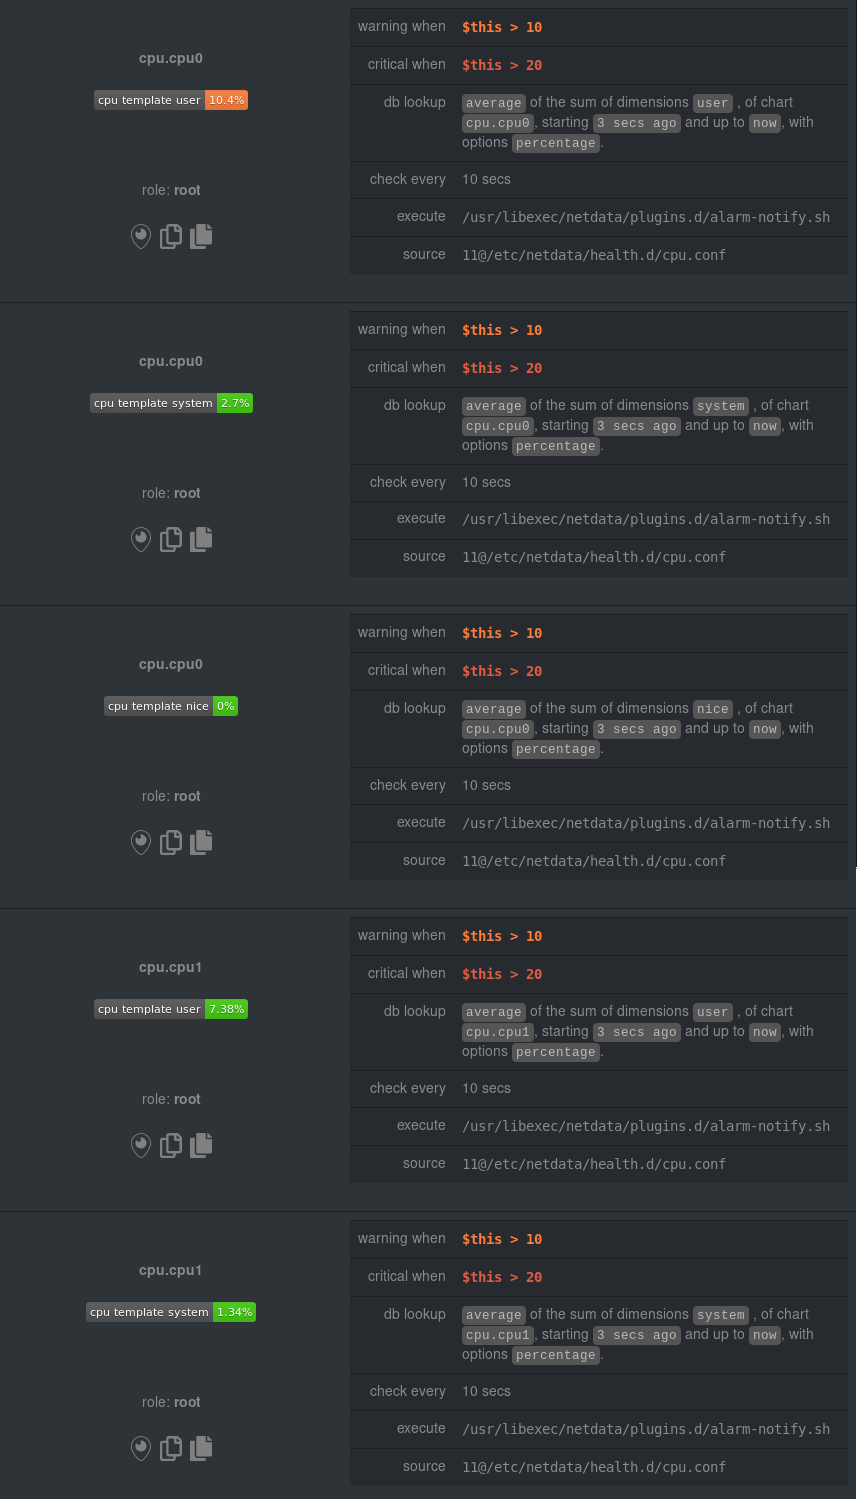
All in all, this single entity creates 36 individual alarms. Much easier than writing 36 separate entities in your health configuration files!
Troubleshooting
You can compile Netdata with debugging and then set in netdata.conf:
[global]
   debug flags = 0x0000000000800000
Then check your /var/log/netdata/debug.log. It will show you how it works. Important: this will generate a lot of
output in debug.log.
You can find the context of charts by looking up the chart in either http://NODE:19999/netdata.conf or
http://NODE:19999/api/v1/charts, replacing NODE with the IP address or hostname for your Agent dashboard.
You can find how Netdata interpreted the expressions by examining the alarm at
http://NODE:19999/api/v1/alarms?all. For each expression, Netdata will return the expression as given in its
config file, and the same expression with additional parentheses added to indicate the evaluation flow of the
expression.