
|
|
1 year ago | |
|---|---|---|
| .. | ||
| fluent_bit_build | 1 year ago | |
| rrd_api | 1 year ago | |
| stock_conf | 1 year ago | |
| unit_test | 1 year ago | |
| Makefile.am | 1 year ago | |
| README.md | 1 year ago | |
| circular_buffer.c | 1 year ago | |
| circular_buffer.h | 1 year ago | |
| db_api.c | 1 year ago | |
| db_api.h | 1 year ago | |
| defaults.h | 1 year ago | |
| file_info.h | 1 year ago | |
| flb_plugin.c | 1 year ago | |
| flb_plugin.h | 1 year ago | |
| functions.c | 1 year ago | |
| functions.h | 1 year ago | |
| helper.h | 1 year ago | |
| logsmanag_config.c | 1 year ago | |
| logsmanag_config.h | 1 year ago | |
| logsmanagement.c | 1 year ago | |
| parser.c | 1 year ago | |
| parser.h | 1 year ago | |
| query.c | 1 year ago | |
| query.h | 1 year ago | |
README.md
Logs Management
Table of Contents
- Summary
- Getting Started
- Package Requirements
- General Configuration
- Collector-specific Configuration
- Custom Charts
- Streaming logs to Netdata
- Streaming logs from Netdata (exporting)
- Troubleshooting
Summary
The Netdata logs management engine enables collection, processing, storage, streaming and querying of logs through the Netdata agent. The following pipeline depicts a high-level overview of the different stages that collected logs propagate through for this to be achieved:
The Fluent Bit project has been used as the logs collection and exporting / streaming engine, due to its stability and the variety of collection (input) plugins that it offers. Each collected log record passes through the Fluent Bit engine first, before it gets buffered, parsed, compressed and (optionally) stored locally by the logs management engine. It can also be streamed to another Netdata or Fluent Bit instance (using Fluent Bit's Forward protocol), or exported using any other Fluent Bit output.
A bespoke circular buffering implementation has been used to maximize performance and optimize memory utilization. More technical details about how it works can be found here.
To configure Netdata's logs management engine properly, please make sure you are aware of the following points first:
- One collection cycle (at max) occurs per
update everyinterval (in seconds - minimum 1 sec) and any log records collected in a collection cycle are grouped together (for compression and performance purposes). As a result of this, a longerupdate everyinterval will reduce memory and disk space requirements. - When collected logs contain parsable timestamps, these will be used to display metrics from parsed logs at the correct time in each chart, even if collection of said logs takes place much later than the time they were produced. How much later? Up to a configurable value of
update timeoutseconds. This mechanism ensures correct parsing and querying of delayed logs that contain parsable timestamps (such as streamed inputs or buffered logs sources that write logs in batches), but the respective charts may lag behind some seconds up to that timeout. If no parsable timestamp is found, the collection timestamp will be used instead (or the collector can be forced to always use the collection timestamp by settinguse log timestamp = no).
Types of available log collectors
The following log collectors are supported at the moment. The table will be updated as more collectors are added:
| Collector | Log type | Description |
| ------------ | ------------ | ------------ |
| kernel logs (kmsg) | flb_kmsg | Collection of new kernel ring buffer logs.|
| systemd | flb_systemd | Collection of journald logs.|
| docker events | flb_docker_events | Collection of docker events logs, similar to executing the docker events command.|
| tail | flb_tail | Collection of new logs from files by "tailing" them, similar to tail -f.|
| web log | flb_web_log | Collection of Apache or Nginx access logs.|
| syslog socket | flb_syslog | Collection of RFC-3164 syslog logs by creating listening sockets.|
| serial | flb_serial | Collection of logs from a serial interface.|
| mqtt | flb_mqtt | Collection of MQTT messages over a TCP connection.|
Getting Started
Since version XXXXX, Netdata is distributed with logs management functionality as an external plugin, but it is disabled by default and must be explicitly enabled using ./edit-config netdata.conf and changing the respective configuration option:
[plugins]
	logs-management = yes
There are some pre-configured log sources that Netdata will attempt to automatically discover and monitor that can be edited using ./edit-config logsmanagement.d/default.conf in Netdata's configuration directory. More sources can be configured for monitoring by adding them in logsmanagement.d/default.conf or in other .conf files in the logsmanagement.d directory.
There are also some example configurations that can be listed using ./edit-config --list.
To get familiar with the Logs Management functionality, the user is advised to read at least the Summary and the General Configuration sections and also any Collector-specific Configuration subsections, according to each use case.
For any issues, please refer to Troubleshooting or open a new support ticket on Github or one of Netdata's support channels.
Package Requirements
Netdata logs management introduces minimal additional package dependencies and those are actually Fluent Bit dependencies. The only extra build-time dependencies are:
flexbisonmusl-fts-dev(Alpine Linux only)
However, there may be some exceptions to this rule as more collectors are added to the logs management engine, so if a specific collector is disabled due to missing dependencies, please refer to this section or check Troubleshooting.
General Configuration
There are some fundamental configuration options that are common to all log collector types. These options can be set globally in logsmanagement.d.conf or they can be customized per log source:
| Configuration Option | Default | Description |
|---|---|---|
update every |
Equivalent value in logsmanagement.d.conf (or in netdata.conf under [plugin:logs-management], if higher). |
How often metrics in charts will be updated every (in seconds). |
update timeout |
Equivalent value in [logs management] section of netdata.conf (or Netdata global value, if higher). |
Maximum timeout charts may be delayed by while waiting for new logs. |
use log timestamp |
Equivalent value in logsmanagement.d.conf (auto by default). |
If set to auto, log timestamps (when available) will be used for precise metrics aggregation. Otherwise (if set to no), collection timestamps will be used instead (which may result in lagged metrics under heavy system load, but it will reduce CPU usage). |
log type |
flb_tail |
Type of this log collector, see relevant table for a complete list of supported collectors. |
circular buffer max size |
Equivalent value in logsmanagement.d.conf. |
Maximum RAM that can be used to buffer collected logs until they are saved to the disk database. |
circular buffer drop logs if full |
Equivalent value in logsmanagement.d.conf (no by default). |
If there are new logs pending to be collected and the circular buffer is full, enabling this setting will allow old buffered logs to be dropped in favor of new ones. If disabled, collection of new logs will be blocked until there is free space again in the buffer (no logs will be lost in this case, but logs will not be ingested in real-time). |
compression acceleration |
Equivalent value in logsmanagement.d.conf (1 by default). |
Fine-tunes tradeoff between log compression speed and compression ratio, see here for more details. |
db mode |
Equivalent value in logsmanagement.d.conf (none by default). |
Mode of logs management database per collector. If set to none, logs will be collected, buffered, parsed and then discarded. If set to full, buffered logs will be saved to the logs management database instead of being discarded. When mode is none, logs management queries cannot be executed. |
buffer flush to DB |
Equivalent value in logsmanagement.d.conf (6 by default). |
Interval in seconds at which logs will be transferred from RAM buffers to the database. |
disk space limit |
Equivalent value in logsmanagement.d.conf (500 MiB by default). |
Maximum disk space that all compressed logs in database can occupy (per log source). Once exceeded, oldest BLOB of logs will be truncated for new logs to be written over. Each log source database can contain a maximum of 10 BLOBs at any point, so each truncation equates to a deletion of about 10% of the oldest logs. The number of BLOBS will be configurable in a future release. |
collected logs total chart enable |
Equivalent value in logsmanagement.d.conf (no by default). |
Chart that shows the number of log records collected for this log source, since the last Netdata agent restart. Useful for debugging purposes. |
collected logs rate chart enable |
Equivalent value in logsmanagement.d.conf (yes by default). |
Chart that shows the rate that log records are collected at for this log source. |
submit logs to system journal = no |
Equivalent value in logsmanagement.d.conf (no by default). Available only for flb_tail, flb_web_log, flb_serial, flb_docker_events and flb_mqtt. |
If enabled, it will submit the collected logs to the system journal. |
There is also one setting that cannot be set per log source, but can only be defined in logsmanagement.d.conf:
| Configuration Option | Default | Description |
|---|---|---|
db dir |
/var/cache/netdata/logs_management_db |
Logs management database path, will be created if it does not exist. |
Note
log pathmust be defined per log source for any collector type, except forkmsgand the collectors that listen to network sockets. Some default examples uselog path = auto. In those cases, an autodetection of the path will be attempted by searching through common paths where each log source is typically expected to be found.
Collector-specific Configuration
Kernel logs (kmsg)
This collector will collect logs from the kernel message log buffer. See also documentation of Fluent Bit kmsg input plugin.
Warning If
use log timestampis set toautoand the system has been in suspend and resumed since the last boot, timestamps of newkmsglogs will be incorrect and log collection will not work. This is a know limitation when reading the kernel log buffer records and it is recommended to useuse log timestamp = noin this case.Note
/dev/kmsgnormally returns all the logs in the kernel log buffer every time it is read. To avoid duplicate logs, the collector will discard any previous logs the first time/dev/kmsgis read after an agent restart and it will collect only new kernel logs.
| Configuration Option | Description |
|---|---|
prio level |
Drop kernel logs with priority higher than prio level. Default value is 8, so no logs will be dropped. |
severity chart |
Enable chart showing Syslog Severity values of collected logs. Severity values are in the range of 0 to 7 inclusive. |
subsystem chart |
Enable chart showing which subsystems generated the logs. |
device chart |
Enable chart showing which devices generated the logs. |
Systemd
This collector will collect logs from the journald daemon. See also documentation of Fluent Bit systemd input plugin.
| Configuration Option | Description |
|---|---|
log path |
Path to the systemd journal directory. If set to auto, the default path will be used to read local-only logs. |
priority value chart |
Enable chart showing Syslog Priority values (PRIVAL) of collected logs. The Priority value ranges from 0 to 191 and represents both the Facility and Severity. It is calculated by first multiplying the Facility number by 8 and then adding the numerical value of the Severity. Please see the rfc5424: Syslog Protocol document for more information. |
severity chart |
Enable chart showing Syslog Severity values of collected logs. Severity values are in the range of 0 to 7 inclusive. |
facility chart |
Enable chart showing Syslog Facility values of collected logs. Facility values show which subsystem generated the log and are in the range of 0 to 23 inclusive. |
Docker events
This collector will use the Docker API to collect Docker events logs. See also documentation of Fluent Bit docker events input plugin.
| Configuration Option | Description |
|---|---|
log path |
Docker socket UNIX path. If set to auto, the default path (/var/run/docker.sock) will be used. |
event type chart |
Enable chart showing the Docker object type of the collected logs. |
event action chart |
Enable chart showing the Docker object action of the collected logs. |
Tail
This collector will collect any type of logs from a log file, similar to executing the tail -f command. See also documentation of Fluent Bit tail plugin.
| Configuration Option | Description |
|---|---|
log path |
The path to the log file to be monitored. |
use inotify |
Select between inotify and file stat watchers (providing libfluent-bit.so has been built with inotify support). It defaults to yes. Set to no if abnormally high CPU usage is observed or if the log source is expected to consistently produce tens of thousands of (unbuffered) logs per second. |
Web log
This collector will collect Apache and Nginx access logs.
| Configuration Option | Description |
|---|---|
log path |
The path to the web server's access.log. If set to auto, the collector will attempt to auto-discover it, provided the name of the configuration section is either Apache access.log or Nginx access.log. |
use inotify |
Select between inotify and file stat watchers (providing libfluent-bit.so has been built with inotify support). It defaults to yes. Set to no if abnormally high CPU usage is observed or if the log source is expected to consistently produce tens of thousands of (unbuffered) logs per second. |
log format |
The log format to be used for parsing. Unlike the [GO weblog]() module, only the CSV parser is supported and it can be configured in the same way as in the GO module. If set to auto, the collector will attempt to auto-detect the log format using the same logic explained here. |
verify parsed logs |
If set to yes, the parser will attempt to verify that the parsed fields are valid, before extracting metrics from them. If they are invalid (for example, the response code is less than 100), the invalid dimension will be incremented instead. Setting this to no will result in a slight performance gain. |
vhosts chart |
Enable chart showing names of the virtual hosts extracted from the collected logs. |
ports chart |
Enable chart showing port numbers extracted from the collected logs. |
IP versions chart |
Enable chart showing IP versions (v4 or v6) extracted from the collected logs. |
unique client IPs - current poll chart |
Enable chart showing unique client IPs in each collection interval. |
unique client IPs - all-time chart |
Enable chart showing unique client IPs since agent startup. It is recommended to set this to no as it can have a negative impact on long-term performance. |
http request methods chart |
Enable chart showing HTTP request methods extracted from the collected logs. |
http protocol versions chart |
Enable chart showing HTTP protocol versions exctracted from the collected logs. |
bandwidth chart |
Enable chart showing request and response bandwidth extracted from the collected logs. |
timings chart |
Enable chart showing request processing time stats extracted from the collected logs. |
response code families chart |
Enable chart showing response code families (1xx, 2xx etc.) extracted from the collected logs. |
response codes chart |
Enable chart showing response codes extracted from the collected logs. |
response code types chart |
Enable chart showing response code types (success, redirect etc.) extracted from the collected logs. |
SSL protocols chart |
Enable chart showing SSL protocols (TLSV1, TLSV1.1 etc.) exctracted from the collected logs. |
SSL chipher suites chart |
Enable chart showing SSL chipher suites exctracted from the collected logs. |
Syslog socket
This collector will collect logs through a Unix socket server (UDP or TCP) or over the network using TCP or UDP. See also documentation of Fluent Bit syslog input plugin.
| Configuration Option | Description |
|---|---|
mode |
Type of socket to be created to listen for incoming syslog messages. Supported modes are: unix_tcp, unix_udp, tcp and udp. |
log path |
If mode == unix_tcp or mode == unix_udp, Netdata will create a UNIX socket on this path to listen for syslog messages. Otherwise, this option is not used. |
unix_perm |
If mode == unix_tcp or mode == unix_udp, this sets the permissions of the generated UNIX socket. Otherwise, this option is not used. |
listen |
If mode == tcp or mode == udp, this sets the network interface to bind. |
port |
If mode == tcp or mode == udp, this specifies the port to listen for incoming connections. |
log format |
This is a Ruby Regular Expression to define the expected syslog format. Fluent Bit provides some pre-configured syslog parsers. |
priority value chart |
Please see the respective systemd configuration. |
severity chart |
Please see the respective systemd configuration. |
facility chart |
Please see the respective systemd configuration. |
For parsing and metrics extraction to work properly, please ensure fields <PRIVAL>, <SYSLOG_TIMESTAMP>, <HOSTNAME>, <SYSLOG_IDENTIFIER>, <PID> and <MESSAGE> are defined in log format. For example, to parse incoming syslog-rfc3164 logs, the following regular expression can be used:
/^\<(?<PRIVAL>[0-9]+)\>(?<SYSLOG_TIMESTAMP>[^ ]* {1,2}[^ ]* [^ ]* )(?<HOSTNAME>[^ ]*) (?<SYSLOG_IDENTIFIER>[a-zA-Z0-9_\/\.\-]*)(?:\[(?<PID>[0-9]+)\])?(?:[^\:]*\:)? *(?<MESSAGE>.*)$/
Serial
This collector will collect logs through a serial interface. See also documentation of Fluent Bit serial interface input plugin.
| Configuration Option | Description |
|---|---|
log path |
Absolute path to the device entry, e.g: /dev/ttyS0. |
bitrate |
The bitrate for the communication, e.g: 9600, 38400, 115200, etc.. |
min bytes |
The minimum bytes the serial interface will wait to receive before it begines to process the log message. |
separator |
An optional separator string to determine the end of a log message. |
format |
Specify the format of the incoming data stream. The only option available is 'json'. Note that Format and Separator cannot be used at the same time. |
MQTT
This collector will collect MQTT data over a TCP connection, by spawning an MQTT server through Fluent Bit. See also documentation of Fluent Bit MQTT input plugin.
| Configuration Option | Description |
|---|---|
listen |
Specifies the network interface to bind. |
port |
Specifies the port to listen for incoming connections. |
topic chart |
Enable chart showing MQTT topic of incoming messages. |
Custom Charts
In addition to the predefined charts, each log source supports the option to extract
user-defined metrics, by matching log records to POSIX Extended Regular Expressions.
This can be very useful particularly for FLB_TAIL type log sources, where
there is no parsing at all by default.
To create a custom chart, the following key-value configuration options must be added to the respective log source configuration section:
	custom 1 chart = identifier
	custom 1 regex name = kernel
	custom 1 regex = .*\bkernel\b.*
	custom 1 ignore case = no
where the value denoted by:
custom x chartis the title of the chart.custom x regex nameis an optional name for the dimension of this particular metric (if absent, the regex will be used as the dimension name instead).custom x regexis the POSIX Extended Regular Expression to be used to match log records.custom x ignore caseis equivalent to settingREG_ICASEwhen using POSIX Extended Regular Expressions for case insensitive searches. It is optional and defaults toyes.
x must start from number 1 and monotonically increase by 1 every time a new regular expression is configured.
If the titles of two or more charts of a certain log source are the same, the dimensions will be grouped together
in the same chart, rather than a new chart being created.
Example of configuration for a generic log source collection with custom regex-based parsers:
[Auth.log]
## Example: Log collector that will tail auth.log file and count
## occurences of certain `sudo` commands, using POSIX regular expressions.
## Required settings
enabled = no
log type = flb_tail
## Optional settings, common to all log source.
## Uncomment to override global equivalents in netdata.conf.
# update every = 1
# update timeout = 10
# use log timestamp = auto
# circular buffer max size MiB = 64
# circular buffer drop logs if full = no
# compression acceleration = 1
# db mode = none
# circular buffer flush to db = 6
# disk space limit MiB = 500
## This section supports auto-detection of log file path if section name
## is left unchanged, otherwise it can be set manually, e.g.:
## log path = /var/log/auth.log
## See README for more information on 'log path = auto' option
log path = auto
## Use inotify instead of file stat watcher. Set to 'no' to reduce CPU usage.
use inotify = yes
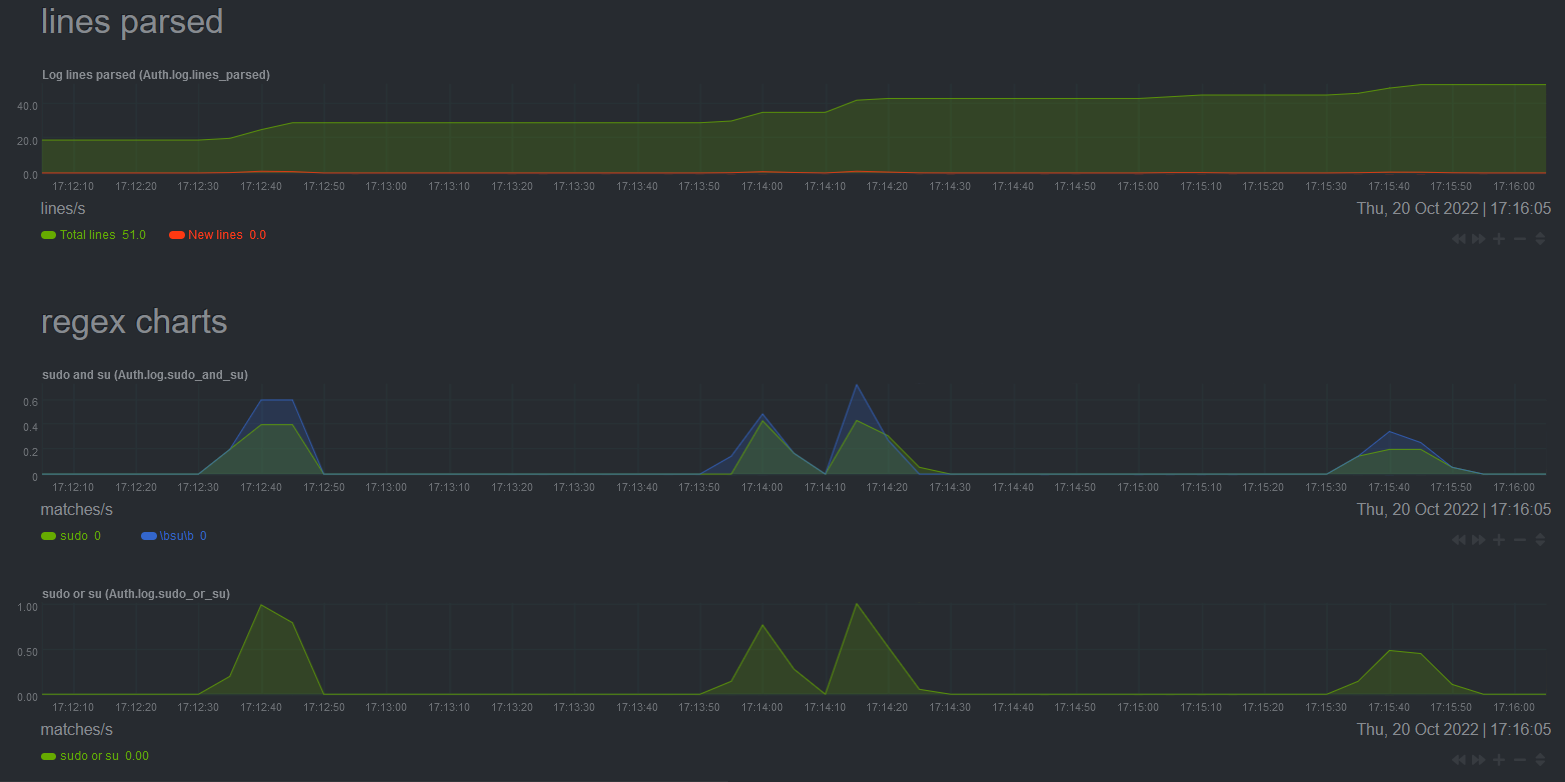
custom 1 chart = sudo and su
custom 1 regex name = sudo
custom 1 regex = \bsudo\b
custom 1 ignore case = yes
custom 2 chart = sudo and su
# custom 2 regex name = su
custom 2 regex = \bsu\b
custom 2 ignore case = yes
custom 3 chart = sudo or su
custom 3 regex name = sudo or su
custom 3 regex = \bsudo\b|\bsu\b
custom 3 ignore case = yes
And the generated charts based on this configuration:
Streaming logs to Netdata
Netdata supports 2 incoming streaming configurations:
syslogmessages over Unix or network sockets.- Fluent Bit's Forward protocol.
For option 1, please refer to the syslog collector section. This section will be focused on using option 2.
A Netdata agent can be used as a logs aggregation parent to listen to Forward messages, using either Unix or network sockets. This option is separate to Netdata's metrics streaming and can be used independently of whether that's enabled or not (and it uses a different listening socket too).
This setting can be enabled under the [forward input] section in logsmanagement.d.conf:
[forward input]
    enable = no
    unix path =
    unix perm = 0644
    listen = 0.0.0.0
    port = 24224
The default settings will listen for incoming Forward messages on TCP port 24224. If unix path is set to a valid path, listen and port will be ignored and a unix socket will be created under that path. Make sure that unix perm has the correct permissions set for that unix socket. Please also see Fluent Bit's Forward input plugin documentation.
The Netdata agent will now listen for incoming Forward messages, but by default it won't process or store them. To do that, there must exist at least one log collection, to define how the incoming logs will be processed and stored. This is similar to configuring a local log source, with the difference that log source = forward must be set and also a stream guid must be defined, matching that of the children log sources.
The rest of this section contains some examples on how to configure log collections of different types, using a Netdata parent and Fluent Bit children instances (see also ./edit-config logsmanagement.d/example_forward.conf). Please use the recommended settings on children instances for parsing on parents to work correctly. Also, note that Forward output on children supports optional gzip compression, by using the -p Compress=gzip configuration parameter, as demonstrated in some of the examples.
Example: Systemd log streaming
Example configuration of an flb_docker_events type parent log collection:
[Forward systemd]

	## Required settings
	enabled = yes
	log type = flb_systemd

	## Optional settings, common to all log source.
	## Uncomment to override global equivalents in netdata.conf.
	# update every = 1
	# update timeout = 10
	# use log timestamp = auto
	# circular buffer max size MiB = 64
	# circular buffer drop logs if full = no
	# compression acceleration = 1
	# db mode = none
	# circular buffer flush to db = 6
	# disk space limit MiB = 500

	## Streaming input settings.
	log source = forward
	stream guid = 6ce266f5-2704-444d-a301-2423b9d30735

	## Other settings specific to this log source type
	priority value chart = yes
	severity chart = yes
	facility chart = yes
Any children can be configured as follows:
fluent-bit -i systemd -p Read_From_Tail=on -p Strip_Underscores=on -o forward -p Compress=gzip -F record_modifier -p 'Record="stream guid" 6ce266f5-2704-444d-a301-2423b9d30735' -m '*'
Example: Kernel log streaming
Example configuration of an flb_kmsg type parent log collection:
[Forward kmsg]

	## Required settings
	enabled = yes
	log type = flb_kmsg

	## Optional settings, common to all log source.
	## Uncomment to override global equivalents in netdata.conf.
	# update every = 1
	# update timeout = 10
	use log timestamp = no
	# circular buffer max size MiB = 64
	# circular buffer drop logs if full = no
	# compression acceleration = 1
	# db mode = none
	# circular buffer flush to db = 6
	# disk space limit MiB = 500

	## Streaming input settings.
	log source = forward
	stream guid = 6ce266f5-2704-444d-a301-2423b9d30736

	## Other settings specific to this log source type
	severity chart = yes
	subsystem chart = yes
	device chart = yes
Any children can be configured as follows:
fluent-bit -i kmsg -o forward -p Compress=gzip -F record_modifier -p 'Record="stream guid" 6ce266f5-2704-444d-a301-2423b9d30736' -m '*'
Note Fluent Bit's
kmsginput plugin will collect all kernel logs since boot every time it's started up. Normally, when configured as a local source in a Netdata agent, all these initially collected logs will be discarded at startup so they are not duplicated. This is not possible when streaming from a Fluent Bit child, so every time a child is restarted, all kernel logs since boot will be re-collected and streamed again.
Example: Generic log streaming
This is the most flexible option for a parent log collection, as it allows aggregation of logs from multiple children Fluent Bit instances of different log types. Example configuration of a generic parent log collection with db mode = full:
[Forward collection]

	## Required settings
	enabled = yes
	log type = flb_tail

	## Optional settings, common to all log source.
	## Uncomment to override global equivalents in netdata.conf.
	# update every = 1
	# update timeout = 10
	# use log timestamp = auto
	# circular buffer max size MiB = 64
	# circular buffer drop logs if full = no
	# compression acceleration = 1
	db mode = full
	# circular buffer flush to db = 6
	# disk space limit MiB = 500

	## Streaming input settings.
	log source = forward
	stream guid = 6ce266f5-2704-444d-a301-2423b9d30738
Children can be configured to tail local logs using Fluent Bit and stream them to the parent:
fluent-bit -i tail -p Path=/tmp/test.log -p Inotify_Watcher=true -p Refresh_Interval=1 -p Key=msg -o forward -p Compress=gzip -F record_modifier -p 'Record="stream guid" 6ce266f5-2704-444d-a301-2423b9d30738' -m '*'
Children instances do not have to use the tail input plugin specifically. Any of the supported log types can be used for the streaming child. The following configuration for example can stream systemd logs to the same parent as the configuration above:
fluent-bit -i systemd -p Read_From_Tail=on -p Strip_Underscores=on -o forward -p Compress=gzip -F record_modifier -p 'Record="stream guid" 6ce266f5-2704-444d-a301-2423b9d30738' -m '*'
The caveat is that an flb_tail log collection on a parent won't generate any type-specific charts by default, but custom charts can be of course manually added by the user.
Example: Docker Events log streaming
Example configuration of a flb_docker_events type parent log collection:
[Forward Docker Events]

	## Required settings
	enabled = yes
	log type = flb_docker_events

	## Optional settings, common to all log source.
	## Uncomment to override global equivalents in netdata.conf.
	# update every = 1
	# update timeout = 10
	# use log timestamp = auto
	# circular buffer max size MiB = 64
	# circular buffer drop logs if full = no
	# compression acceleration = 1
	# db mode = none
	# circular buffer flush to db = 6
	# disk space limit MiB = 500

	## Streaming input settings.
	log source = forward
	stream guid = 6ce266f5-2704-444d-a301-2423b9d30737

	## Other settings specific to this log source type
	event type chart = yes
Any children streaming to this collection must be set up to use one of the default json or docker parsers, to send the collected log as structured messages, so they can be parsed by the parent:
fluent-bit -R ~/fluent-bit/conf/parsers.conf -i docker_events -p Parser=json -o forward -F record_modifier -p 'Record="stream guid" 6ce266f5-2704-444d-a301-2423b9d30737' -m '*'
or
fluent-bit -R ~/fluent-bit/conf/parsers.conf -i docker_events -p Parser=docker -o forward -F record_modifier -p 'Record="stream guid" 6ce266f5-2704-444d-a301-2423b9d30737' -m '*'
If instead the user desires to stream to a parent that collects logs into an flb_tail log collection, then a parser is not necessary and the unstructured logs can also be streamed in their original JSON format:
fluent-bit -i docker_events -o forward -F record_modifier -p 'Record="stream guid 6ce266f5-2704-444d-a301-2423b9d30737' -m '*'
Logs will appear in the parent in their unstructured format:
{"status":"create","id":"de2432a4f00bd26a4899dde5633bb16090a4f367c36f440ebdfdc09020cb462d","from":"hello-world","Type":"container","Action":"create","Actor":{"ID":"de2432a4f00bd26a4899dde5633bb16090a4f367c36f440ebdfdc09020cb462d","Attributes":{"image":"hello-world","name":"lucid_yalow"}},"scope":"local","time":1680263414,"timeNano":1680263414473911042}
Streaming logs from Netdata (exporting)
Netdata supports real-time log streaming and exporting through any of Fluent Bit's outgoing streaming configurations.
To use any of the outputs, follow Fluent Bit's documentation with the addition of a output x prefix to all of the configuration parameters of the output. x must start from number 1 and monotonically increase by 1 every time a new output is configured for the log source.
For example, the following configuration will add 2 outputs to a docker events log collector. The first output will stream logs to https://cloud.openobserve.ai/ using Fluent Bit's http output plugin and the second one will save the same logs in a file in CSV format, using Fluent Bit's file output plugin:
[Docker Events Logs]
	## Example: Log collector that will monitor the Docker daemon socket and
	## collect Docker event logs in a default format similar to executing
	## the `sudo docker events` command.

	## Required settings
	enabled = yes
	log type = flb_docker_events

	## Optional settings, common to all log source.
	## Uncomment to override global equivalents in netdata.conf.
	# update every = 1
	# update timeout = 10
	# use log timestamp = auto
	# circular buffer max size MiB = 64
	# circular buffer drop logs if full = no
	# compression acceleration = 1
	# db mode = none
	# circular buffer flush to db = 6
	# disk space limit MiB = 500

	## Use default Docker socket UNIX path: /var/run/docker.sock
	log path = auto

	## Charts to enable
	# collected logs total chart enable = no
	# collected logs rate chart enable = yes
	event type chart = yes
	event action chart = yes

	## Stream to https://cloud.openobserve.ai/
	output 1 name             = http
	output 1 URI              = YOUR_API_URI
	output 1 Host             = api.openobserve.ai
	output 1 Port             = 443
	output 1 tls              = On
	output 1 Format           = json
	output 1 Json_date_key    = _timestamp
	output 1 Json_date_format = iso8601
	output 1 HTTP_User        = test@netdata.cloud
	output 1 HTTP_Passwd      = YOUR_OPENOBSERVE_PASSWORD
	output 1 compress         = gzip

	## Real-time export to /tmp/docker_event_logs.csv
	output 2 name             = file
	output 2 Path             = /tmp
	output 2 File             = docker_event_logs.csv
Troubleshooting
- I am building Netdata from source or a Git checkout but the
FLB_SYSTEMDplugin is not available / does not work:
If during the Fluent Bit build step you are seeing the following message:
-- Could NOT find Journald (missing: JOURNALD_LIBRARY JOURNALD_INCLUDE_DIR)
it means that the systemd development libraries are missing from your system. Please see how to install them alongside other required packages.
- I am observing very high CPU usage when monitoring a log source using
flb_tailorflb_web_log.
The log source is probably producing a very high number of unbuffered logs, which results in too many filesystem events. Try setting use inotify = no to use file stat watchers instead.
- I am using Podman instead of Docker, but I cannot see any Podman events logs being collected.
Please ensure there is a listening service running that answers API calls for Podman. Instructions on how to start such a service can be found here.
Once the service is started, you must updated the Docker events logs collector log path to monitor the generated socket (otherwise, it will search for a dock.sock by default).
You must ensure podman.sock has the right permissions for Netdata to be able to access it.