
|
|
1 year ago | |
|---|---|---|
| .. | ||
| Makefile.inc | 2 years ago | |
| README.md | 1 year ago | |
| pandas.chart.py | 1 year ago | |
| pandas.conf | 2 years ago | |
README.md
Ingest structured data (Pandas)

Pandas is a de-facto standard in reading and processing most types of structured data in Python. If you have metrics appearing in a CSV, JSON, XML, HTML, or other supported format, either locally or via some HTTP endpoint, you can easily ingest and present those metrics in Netdata, by leveraging the Pandas collector.
The collector uses pandas to pull data and do pandas-based preprocessing, before feeding to Netdata.
Requirements
This collector depends on some Python (Python 3 only) packages that can usually be installed via pip or pip3.
sudo pip install pandas requests
Note: If you would like to use pandas.read_sql to query a database, you will need to install the below packages as well.
sudo pip install 'sqlalchemy<2.0' psycopg2-binary
Configuration
Below is an example configuration to query some json weather data from Open-Meteo, do some data wrangling on it and save in format as expected by Netdata.
# example pulling some hourly temperature data
temperature:
    name: "temperature"
    update_every: 3
    chart_configs:
      - name: "temperature_by_city"
        title: "Temperature By City"
        family: "temperature.today"
        context: "pandas.temperature"
        type: "line"
        units: "Celsius"
        df_steps: >
          pd.DataFrame.from_dict(
            {city: requests.get(
                f'https://api.open-meteo.com/v1/forecast?latitude={lat}&longitude={lng}&hourly=temperature_2m'
                ).json()['hourly']['temperature_2m']
            for (city,lat,lng)
            in [
                ('dublin', 53.3441, -6.2675),
                ('athens', 37.9792, 23.7166),
                ('london', 51.5002, -0.1262),
                ('berlin', 52.5235, 13.4115),
                ('paris', 48.8567, 2.3510),
                ]
            }
            );                                                         # use dictionary comprehension to make multiple requests;
          df.describe();                                               # get aggregate stats for each city;
          df.transpose()[['mean', 'max', 'min']].reset_index();        # just take mean, min, max;
          df.rename(columns={'index':'city'});                         # some column renaming;
          df.pivot(columns='city').mean().to_frame().reset_index();    # force to be one row per city;
          df.rename(columns={0:'degrees'});                            # some column renaming;
          pd.concat([df, df['city']+'_'+df['level_0']], axis=1);       # add new column combining city and summary measurement label;
          df.rename(columns={0:'measurement'});                        # some column renaming;
          df[['measurement', 'degrees']].set_index('measurement');     # just take two columns we want;
          df.sort_index();                                             # sort by city name;
          df.transpose();                                              # transpose so its just one wide row;
chart_configs is a list of dictionary objects where each one defines the sequence of df_steps to be run using pandas,
and the name, title etc to define the
CHART variables
that will control how the results will look in netdata.
The example configuration above would result in a data dictionary like the below being collected by Netdata
at each time step. They keys in this dictionary will be the "dimensions" of the chart.
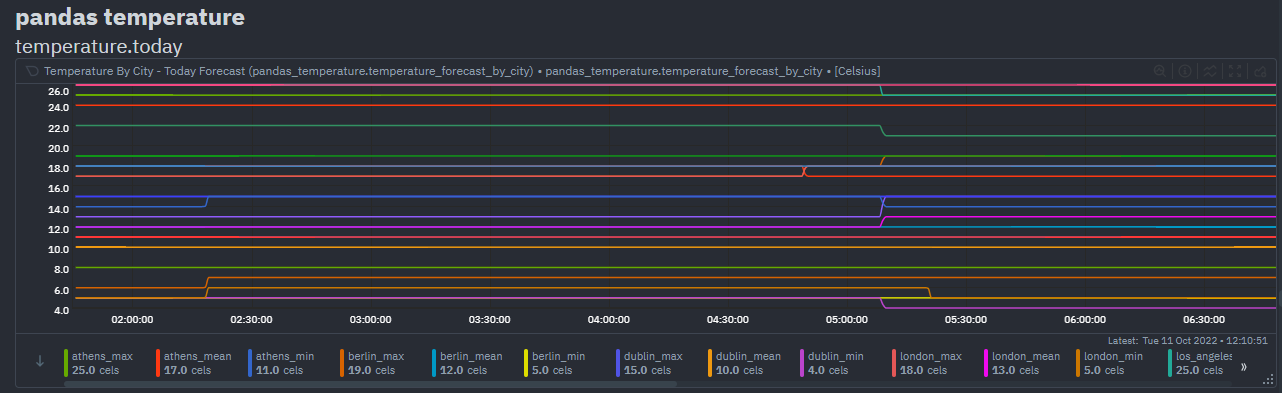
{'athens_max': 26.2, 'athens_mean': 19.45952380952381, 'athens_min': 12.2, 'berlin_max': 17.4, 'berlin_mean': 10.764285714285714, 'berlin_min': 5.7, 'dublin_max': 15.3, 'dublin_mean': 12.008928571428571, 'dublin_min': 6.6, 'london_max': 18.9, 'london_mean': 12.510714285714286, 'london_min': 5.2, 'paris_max': 19.4, 'paris_mean': 12.054166666666665, 'paris_min': 4.8}
Which, given the above configuration would end up as a chart like below in Netdata.
Notes
- Each line in
df_stepsmust return a pandas DataFrame object (df) at each step. - You can use
this colab notebook
to mock up and work on your
df_stepsiteratively before adding them to your config. - This collector is expecting one row in the final pandas DataFrame. It is that first row that will be taken
as the most recent values for each dimension on each chart using (
df.to_dict(orient='records')[0]). See pd.to_dict().